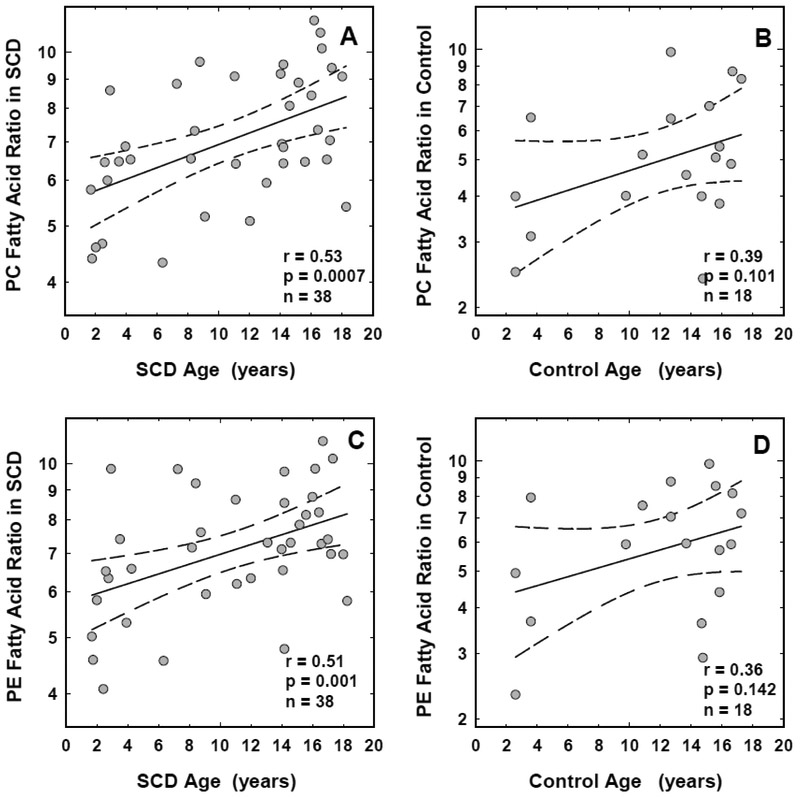
FIGURE 1: Association between age and fatty acid ratios in red cell phospholipids from children with sickle cell disease and race-matched controls.
Association between age and the fatty acid ratios in red cell PC (panel A) and PE (panel C) fractions from children with sickle cell disease, and the PC (panel B) and PE (panel D) fractions from race-matched controls are shown. The solid and the dotted lines represent the linear regression fit to the data, and the 95% confidence interval curves, respectively. The correlation coefficient (r) and the significance (p) values shown for each correlation were obtained using the Pearson correlation test with logtransformed data. Similar results were observed when the data was analyzed using the Spearman rank correlation test.

