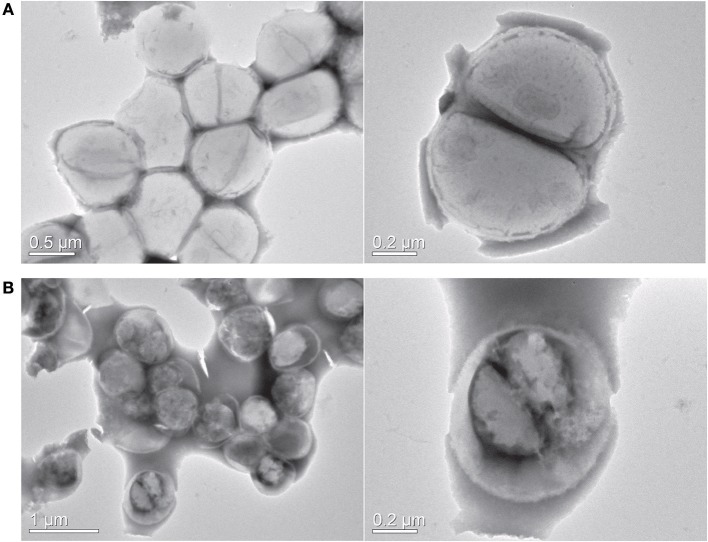
Figure 5.
Transmission electron microscopy. (A) Control cells (B) Y5-P1 treated cells. Right panel shows the cell shape and morphology at higher magnification. Upon the treatment, the cells displayed a distorted morphology, and intracellular material is aggregated. Also, the bacteria are showing the disrupted cell division.

