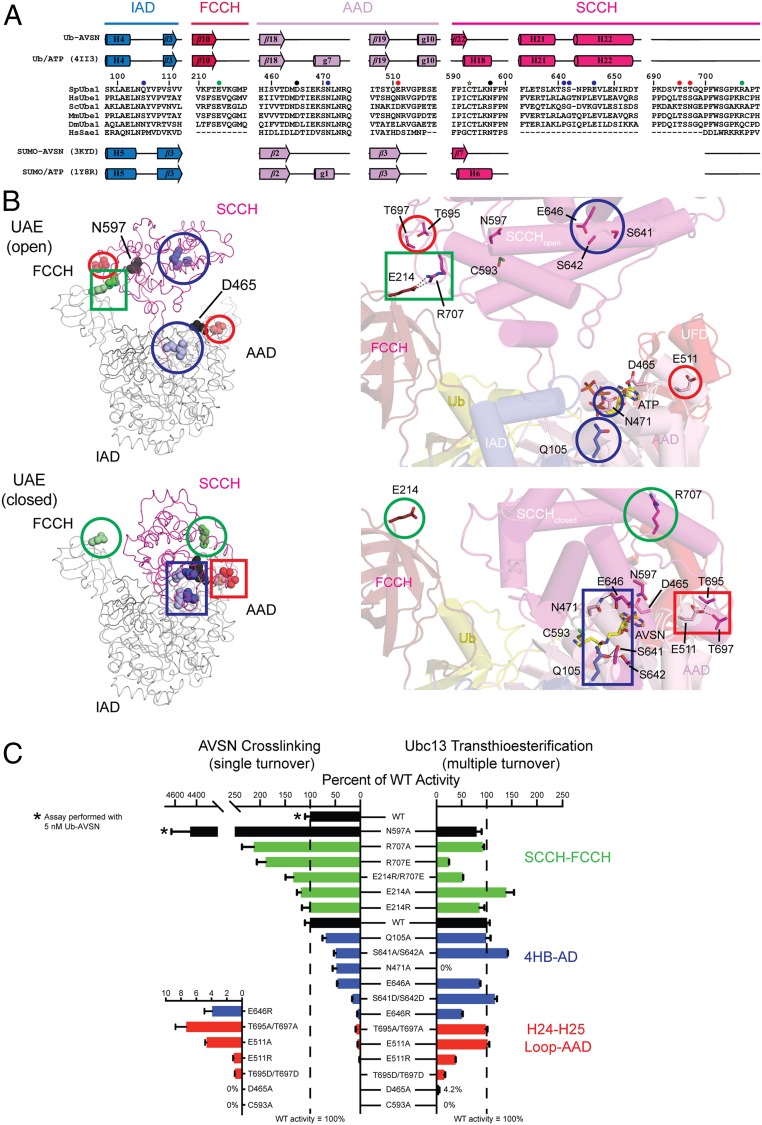
Fig. 6.
Mutational analysis of interdomain contacts unique to the closed conformation of Uba1. (A) Structure-based alignment of Ub E1 amino acid sequences from (top to bottom) S. pombe, H. sapiens, Saccharomyces cerevisiae, M. musculus, Drosophila melanogaster, and SAE from H. sapiens. Residues at the interface between SCCH and FCCH domains are indicated by green circles; residues at the interface between the 4-helix bundle (4HB) of the SCCH domain and the adenylation domain (IAD/AAD) are denoted by blue circles; residues at the interface between the H24-H25 loop and the AAD domain are indicated by red circles. Asp465 and Asn597 are marked by black circles. Active site cysteine residue is marked with a star. Secondary structure elements are indicated for Uba1 (top) and SAE (bottom) in the open (ATP) and closed (AVSN) conformations. (B) Ribbon representation of crystal structures of Uba1/Ub in the open (Top) and closed (Bottom) conformations are shown on the Left, with residues highlighted in A in colored spheres. Circles surround residues not making interdomain contacts; rectangles enclose interdomain contacts. On the Right, a close-up view showing residue contacts with structures depicted in cartoon, with relevant side chains in stick. Potential hydrogen-bonding interactions are indicated by gray dashed lines. Residues, boxes, and circles are color coded as described for A. Close-up views at Right are in the same orientations as global views at Left. Domain colors are as in Fig. 2. (C) Bar graph depicting measured rates of cross-linking between Ub-AVSN and Uba1 harboring substitutions in interdomain interfaces (left) or measured rates for Uba1-Ubc13 transthioesterification using Ub with native C terminus for the same substitutions (right). Values represent the average of 3 independent experiments and are displayed as percentages of the average WT value; error bars are 1 SD between experiments and are displayed as percentages of the average WT value. Colors are as described for A.

