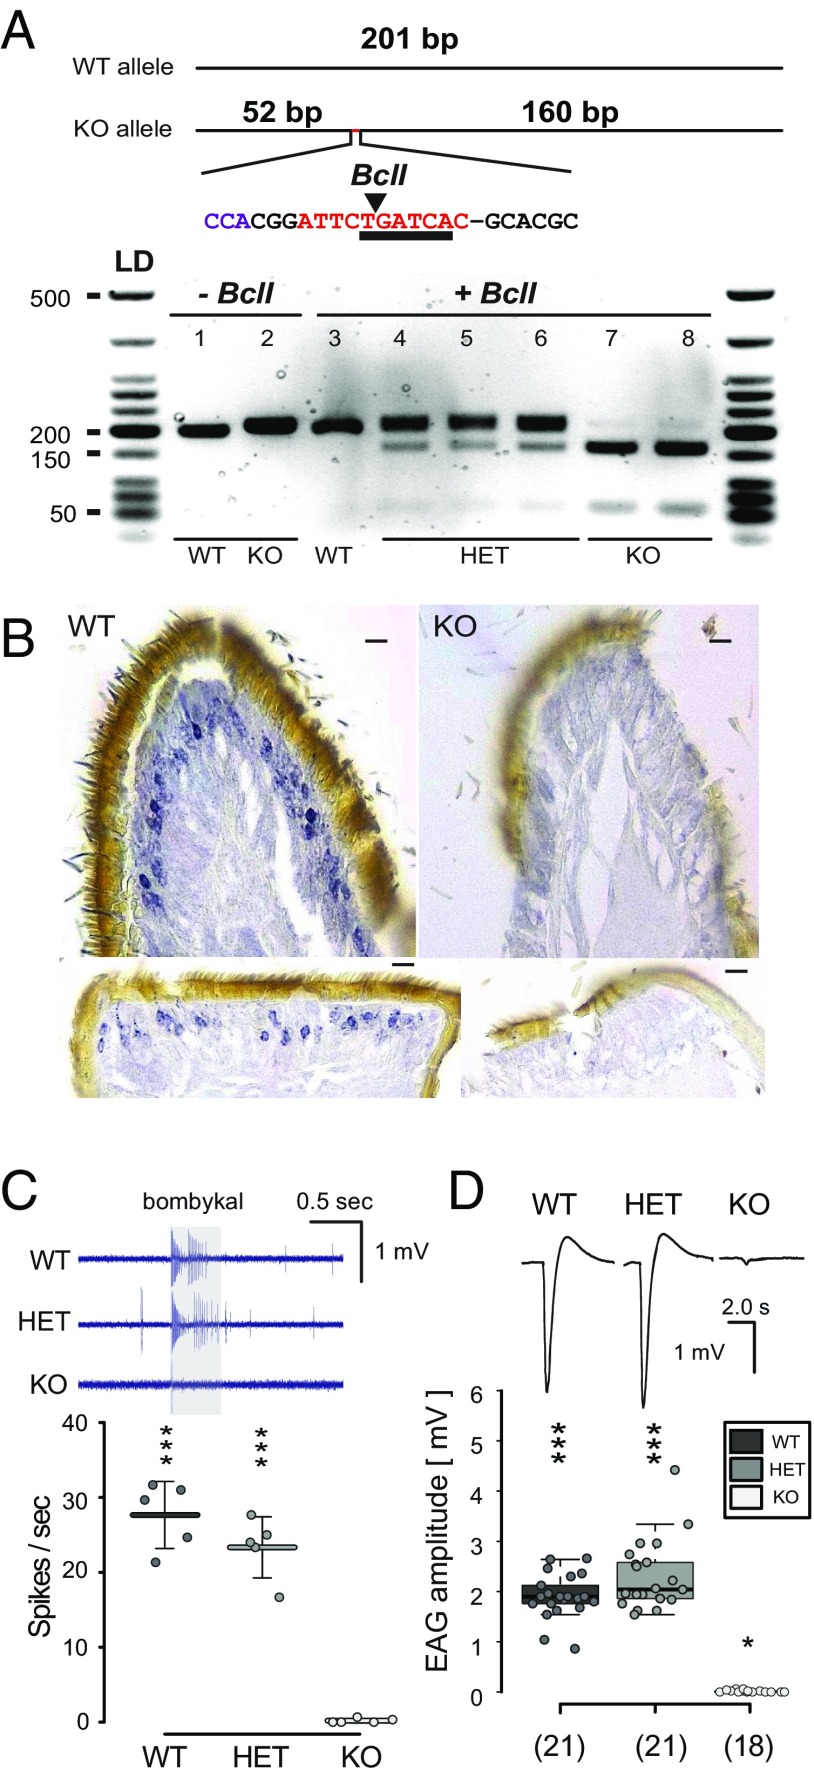
Fig. 2.
Genotyped M. sexta Orco KOs do not express Orco or respond to conspecific female sex pheromone. (A, Top) Genotyping primers designed to amplify 201 bp of the targeted exon 2 of MsexOrco. Orco KO allele produces a 212-bp amplicon, characterized by the (−1, +11) indel, which introduces a Bcl1 restriction enzyme cutting site not found in the WT allele. Insertion indicated in red, restriction site underlined, arrow points to enzymatic cut site. (A, Bottom) PCR product amplified from individual caterpillar horn tissue samples loaded on a 2.0% agarose gel. Lanes 1 and 2, PCR product with no restriction enzyme added. Lanes 3 through 8, PCR product cut with restriction enzyme. Lane 3, no cut bands from a WT caterpillar. Lanes 4 through 6, ∼200-bp band of PCR product is still dark, with lighter bottom bands at ∼150 and 50 bp, indicative of Orco HET individuals. Lanes 7and 8, ∼200 bp is mostly digested and breaks down to a darker ∼150-bp band and ∼50-bp band, indicative of the homozygous Orco KO individual. (B) Expression of the M. sexta Orco protein in the olfactory sensory neurons (OSNs) was characterized in the WT (Left) and KO (Right) on paraffin-embedded male antennae sections. Nickel-DAB staining with HRP conjugated secondary antibody detected Orco-positive OSNs only in the WT but not in Orco KO hawkmoths. Top, transversal; Bottom, sagittal sections. (Scale bars, 10 μm.) (C) Single sensillum recordings (SSR) from long trichoid sensilla of adult male antennae stimulated with 10−2 (vol/vol) bombykal in mineral oil for 0.5 ms. (Top) Representative SSR traces, odor stimulation indicated by the gray bar. (Bottom) Mean net responses from 3 sensilla per hawkmoth (± SD); circles represent results from individual hawkmoths. Total number of hawkmoths tested n = 5 per genotype (***P ≤ 0.001; not significant, P ≥ 0.05, 1-sample t test versus zero). (D) EAGs from clipped male antennae stimulated with bombykal; same concentration as in C. (Top) Representative EAG recordings. (Bottom) Box plots show the net response, corrected against solvent (*P ≤ 0.05, ***P ≤ 0.001, Wilcoxon rank sum test versus zero). Box plots show the median net EAG amplitude (horizontal line in the box), the 25th and 75th percentiles (lower and upper margins of the box) together with the 1.5× interquartile range (whiskers), and individual data points (circles). Genotyped individuals were all confirmed with EAG recordings, matching genotype to a physiological phenotype.

