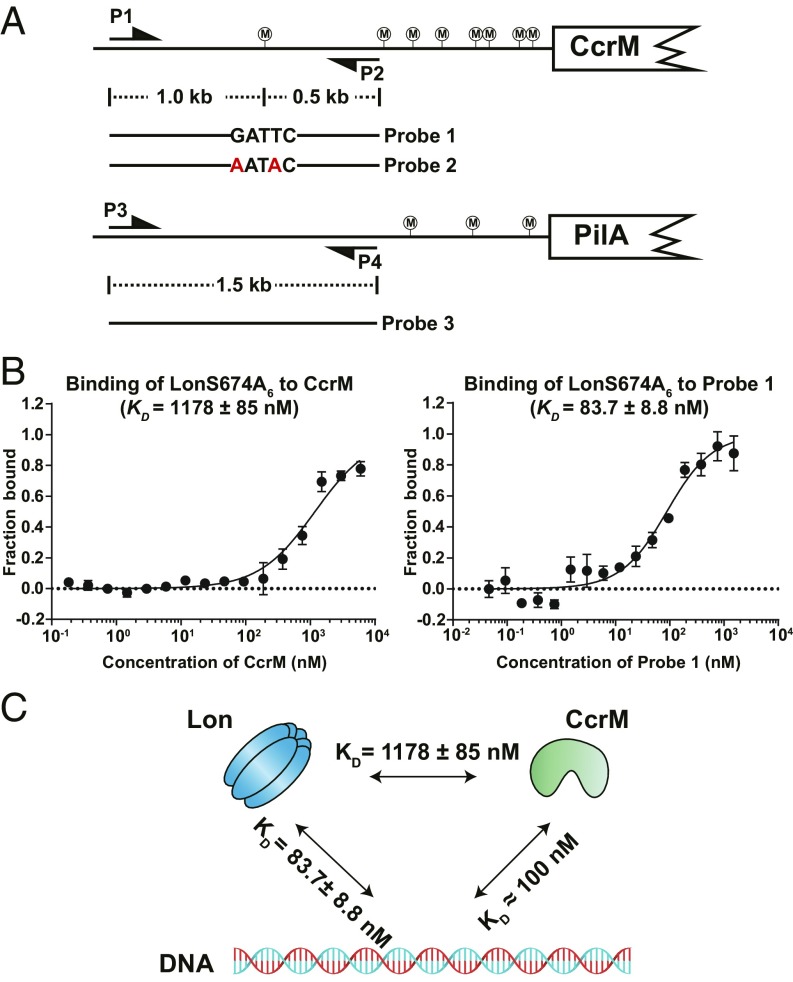
Fig. 2.
DNA binding facilities CcrM-Lon recognition. (A) Schematic view of DNA probe designs according to genome locus. Probe 2 is the same as probe 1 except with the mutation of GATTC to AATAC. Probe 3 contains the upstream sequence of pliA. P1-P2 and P3-P4 are primer pairs to amplify probe 1 (or probe 2) and probe 3, respectively. CcrM methylation sites are shown circled “M.” (B) The direct binding of purified LonS674A to CcrM or probe 1 was measured in vitro by microscale thermophoresis. LonS674A was fluorescently labeled with Atto-488 dye. The concentration of LonS674A6 was held constant at 20 nM while CcrM or probe 1 was titrated in 2-fold serial dilutions against it. The purified proteins were incubated at room temperature for 10 min before the binding assay. The data report the fraction of LonS674A6 that is bound at each concentration of CcrM or probe 1. See Materials and Methods for description of curve fits. (C) A schematic view showing affinities between CcrM, Lon, and DNA. CcrM and Lon have higher affinities to DNA than that of direct interaction.

