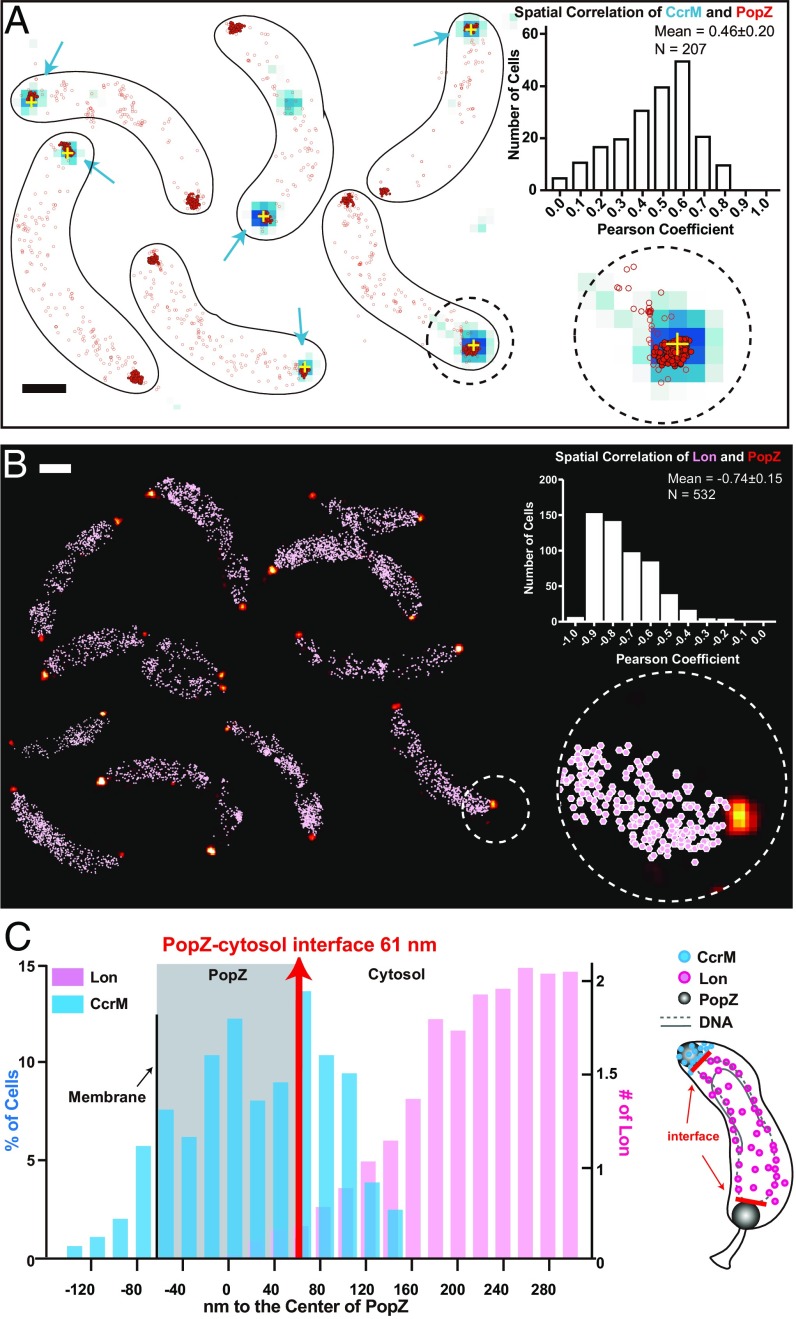
Fig. 5.
Cell-pole sequestration separates CcrM from chromosomal DNA and the Lon protease. (A) Cells are shown with CcrM-eYFP diffraction-limited data overlaid with its centroid location (blue signal with yellow cross) and single-molecule localizations of PAmCherry-PopZ (red scatterplot). PAmCherry-PopZ is concentrated at the poles; localizations with more than 30 neighbors within a 100-nm radius are shown in filled red scatters with black outlines. The rest of the PAmCherry-PopZ that are typically nonpolar are shown in empty red circles. (Inset) The spatial correlation of CcrM-eYFP and PAmCherry-PopZ across 207 cells exhibited an average Pearson’s correlation coefficient of 0.46. (Scale bar, 600 nm.) This is a montage of different fields of view. (B) PAmCherry-PopZ localizations in 25-nm bins (yellow-red color scale) along with all Lon-eYFP localizations (pink scatterplot). The spatial correlation of PAmCherry-PopZ and Lon-eYFP across 270 cells (532 values) exhibited an average Pearson’s correlation coefficient of −0.74. (Scale bar, 600 nm.) This is a montage of a different field of views. (C) Distributions of the distance between the centroid of the CcrM-eYFP cluster to the center of PAmCherry-PopZ (blue) and the averaged distribution of distances between Lon-eYFP to the center of PAmCherry-PopZ (pink). The average distance of ParB-eYFP to PopZ was marked to show the PopZ-cytosol interface (red). The area that PopZ covers is marked by the gray shading, assuming symmetry along the cellular axis. A cartoon (Right) shows the physical separation between CcrM (blue) and Lon (pink). The cytosolic boundary of the PopZ domain is marked by red lines.

