Fig. 3.
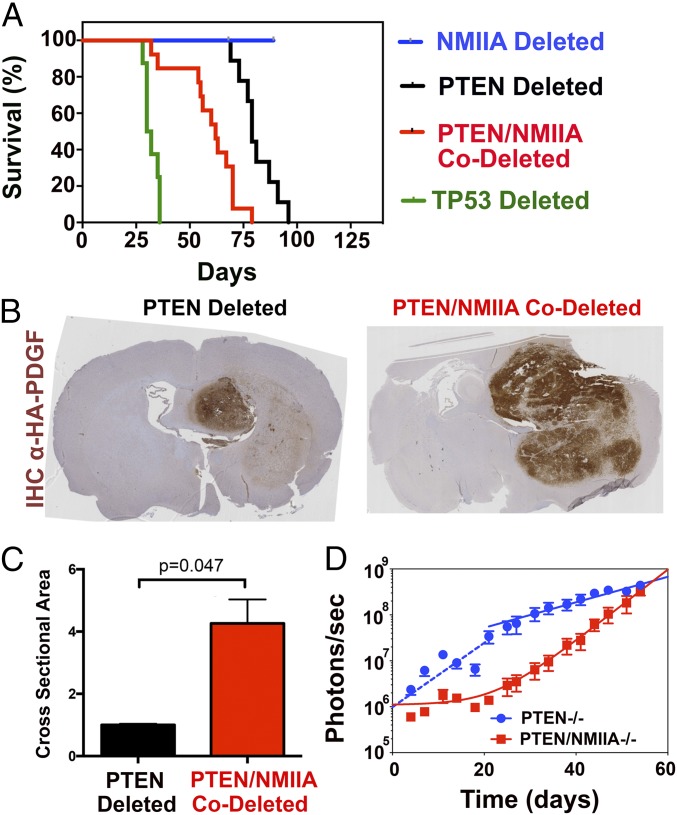
Loss of NMIIA decreases survival in GBM and creates larger tumors. (A) Kaplan–Meier curves of mice bearing retrovirally induced GBMs deleted for PTEN (black, n = 9), NMIIA and PTEN (red, n = 13), TP53 (green, n = 6), and NMIIA (blue, n = 8). Median survivals are 79, 62, and 31 d after injection and not determined, respectively. Log-rank P values are PTEN−/− vs. PTEN−/−NMIIA−/− P = 0.0003, NMIIA−/− vs. PTEN−/−NMIIA−/− P < 0.0001, p53−/− vs. PTEN−/−NMIIA−/− P < 0.0001, and p53−/− vs. NMIIA−/− P < 0.0001. (B) Anti-HA immunohistochemistry of brains from mice with floxed alleles for PTEN or PTEN and NMIIA that were injected 35 d prior with retrovirus encoding a PDGF-HA fusion protein and the cre recombinase. (C) Area of HA-positive tumor measured by number of HA-positive pixels for PTEN-deleted (black) compared with PTEN/MNNIIA codeleted (red) tumors. (D) Fifty thousand luciferase-expressing PTEN-deleted and PTEN/NMIIA-codeleted tumor cells were injected into the white matter of NSG mice. Luminescence was monitored over the subsequent 54 d, and photon flux is plotted on a logarithmic scale versus days after injection. For both tumor types, growth follows a biphasic relationship. For PTEN-deleted cells (blue), this consists of an initial fast phase (blue dashed line) which transitions to a slower phase at ∼3 wk after injection. For PTEN/NMIIA-codeleted cells (red), growth fits a single exponential process that follows an initial lag phase, also lasting about 3 wk. The single exponential fits to the terminal growth phase describe tumor doubling times of 10.9 d (PTEN-deleted) and 3.9 d (PTEN/NMIIA-codeleted).

