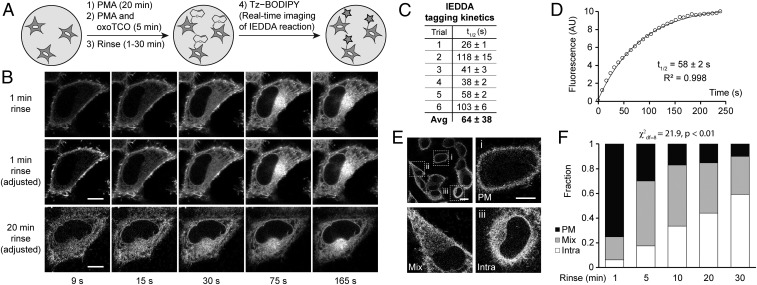
Fig. 5.
Real-time IMPACT enables precise determination of the subcellular localization of active PLD enzymes. (A) The experimental setup for RT-IMPACT is the same as indicated in Fig. 4 except that IEDDA reaction with Tz–BODIPY is monitored in real time by time-lapse confocal microscopy. (B) Representative images from time-lapse RT-IMPACT imaging of HeLa cells. The rinse (chase step) following the transphosphatidylation with (S)-oxoTCO–C1 and before IEDDA tagging was 1 min (Top and Middle) or 20 min (Bottom). (Top) Images are shown with identical intensity settings to facilitate visualization of reaction progress. (Middle and Bottom) Fluorescence intensities of the 9-, 15-, and 30-s time points have been brightened to facilitate visual comparison of localization of the IMPACT signal at different time points. (C and D) Quantification of the kinetics of the IEDDA tagging reaction based on total cellular fluorescence from 6 independent experiments (where the graph represents trial 5, with circles indicating data points, the curve indicating an exponential fit, and R2 indicating the coefficient of determination of the fit) with n = 8 to 16 cells for each trial and average (Avg) reaction half-life (t1/2) indicated as mean ± SD. (E and F) Quantification of the subcellular localizations of RT-IMPACT fluorescent signal at the 9-s time point of the IEDDA reaction as a function of the posttransphosphatidylation chase step, i.e., the rinse time after (S)-oxoTCO–C1 labeling and before IEDDA tagging. Cells were blindly scored as having plasma membrane (PM, black), intracellular (Intra, white), or a combination of PM and intracellular (Mix, gray) IMPACT fluorescence. y axis indicates fraction of cells with the indicated localization. (E, Top Left) Representative zoomed-out image of a population of cells at the 9-s time point from a 20-min rinse time point from F, with examples of PM (i), mix (ii), and intra (iii) localizations indicated in the other panels. (Scale bars: B and E, i–iii, 10 µm; E, Top Left, 20 μm.) Statistical significance was assessed by using a χ2 test for independence, with the χ2 value (df, degrees of freedom) and associated P value indicated. Each bar contains data of 3 to 5 biological replicates with n = 30 to 72 total cells.

