Fig. 6.
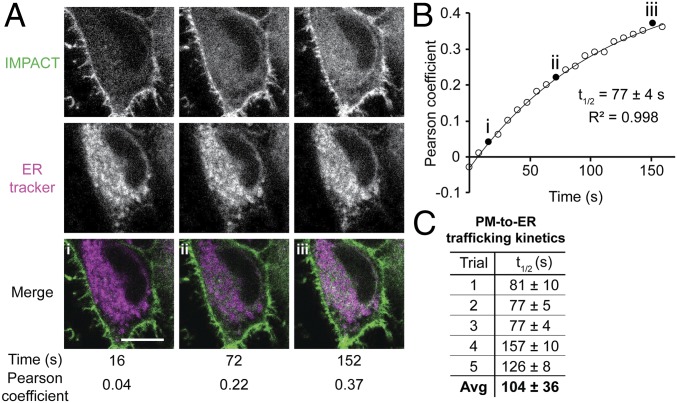
Real-time IMPACT reveals PM-to-ER trafficking of fluorescent lipids. (A) Representative images of HeLa cells from a 2-color time-lapse movie. HeLa cells were incubated with ER tracker, PMA, and (S)-oxoTCO–C1 for 5 min and rinsed for 1 min before time-lapse imaging. Values of Pearson correlation coefficients of colocalization between IMPACT (green) and ER tracker (magenta) were determined. Colocalization appears as white in merge. (B) Representative exponential fitting of kinetics of PM-to-ER trafficking. Plotted is increase in colocalization (Pearson coefficient) between IMPACT and ER tracker over time. Circles are data points, and the curve indicates an exponential fit. Filled circles (i–iii) correspond to Pearson coefficients for the images shown in A, and R2 indicates the coefficient of determination of the fit. (C) Summary of quantification of PM-to-ER trafficking kinetics from 5 independent experiments (where the graph in B represents trial 3) with n = 8 to 16 cells for each trial and average (Avg) half-life of internalization (t1/2) indicated as mean ± SD. (Scale bar: 10 µm.)

