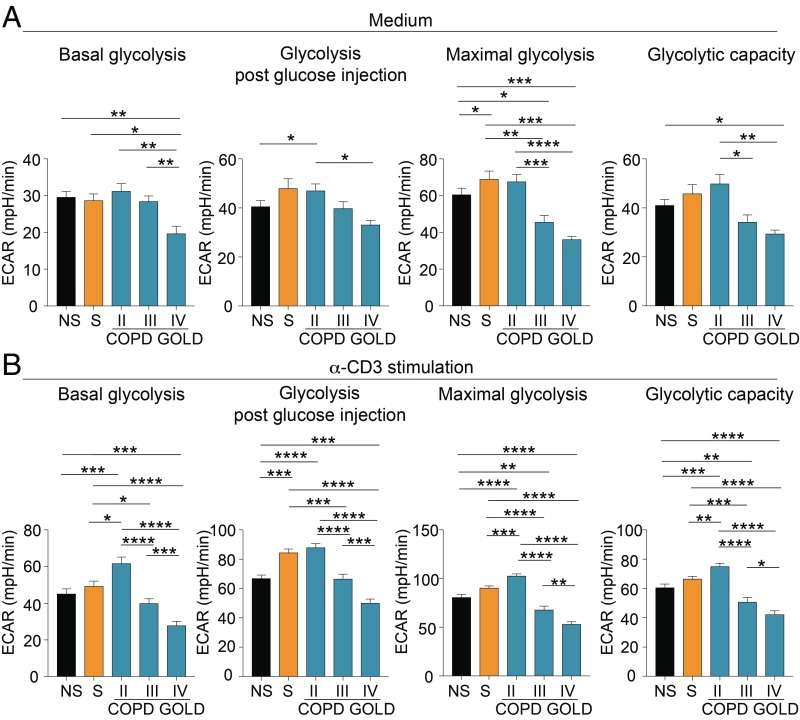
Fig. 2.
Impaired engagement of glycolysis of T cells from COPD subjects during disease progression. (A) Parameters of the glycolytic pathway in unstimulated PBMCs from NS healthy subjects, S healthy subjects, and COPD subjects at different GOLD stages. (B) Parameters of the glycolytic pathway of PBMCs upon 12 h of α-CD3 stimulation from NS, S, and COPD subjects at different GOLD stages. Parameters of the glycolytic pathway (in A and B) were calculated from the ECAR profile: basal glycolysis, glycolysis after glucose injection, maximal glycolysis (after oligomycin addition), and glycolytic capacity (calculated as the difference of oligomycin-induced ECAR and 2-deoxy-d-glucose (2DG)–induced ECAR). For A and B, data are from n = 7 independent experiments (at least n = 2 subjects in 3 technical replicates), and are expressed as mean ± SEM. *P < 0.05; **P < 0.01; ***P < 0.001; ****P < 0.0001 by 2-tailed Mann–Whitney test.

