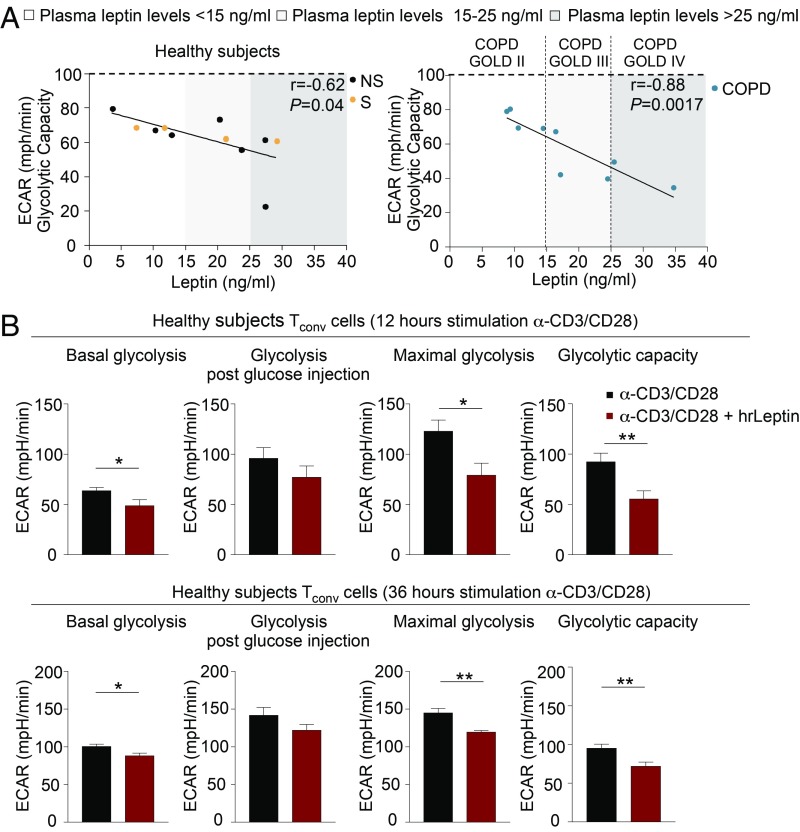
Fig. 3.
Leptin reduces glycolysis of T cells in COPD and healthy subjects. (A) Statistical correlation between plasma leptin levels and glycolytic capacity of TCR-stimulated PBMCs from NS and S healthy subjects (Left) and COPD individuals at different GOLD stages (Right). Different ranges of plasma leptin are indicated: white (<15 ng/mL), light gray (15 to 25 ng/mL), and dark gray (>25 ng/mL) boxes. Data are from n = 7 NS healthy subjects, n = 4 S healthy subjects, and n = 9 COPD subjects; each symbol represents an individual healthy or COPD subject as indicated. r = −0.62, P = 0.04 and r = −0.88, P = 0.0017 by Pearson’s correlation. (B) Parameters of the glycolytic pathway calculated from the ECAR profile in CD4+CD25− (Tconv) cells from healthy subjects stimulated for 12 h (Upper) or 36 h (Lower) with α-CD3/CD28 alone or in presence of hrLeptin. Data are from n = 2 independent experiments at least in 2 technical replicates, and are expressed as mean ± SEM. *P < 0.05; **P < 0.01 by 2-tailed Mann–Whitney test.

