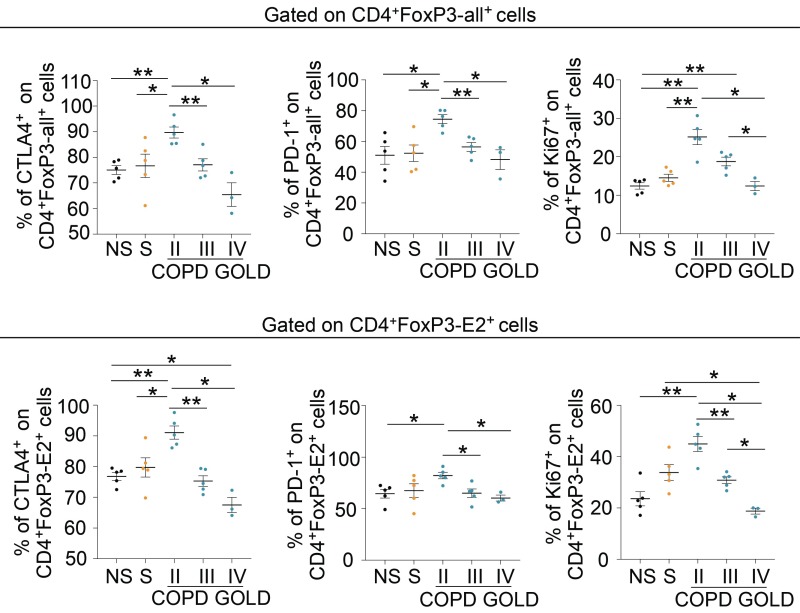
Fig. 5.
Progressive reduction of Treg cell-specific markers in pTreg cells of COPD subjects at different GOLD stages. Cumulative data of the expression of Treg cell-specific markers (CTLA-4 and PD-1) and Ki-67 in peripheral CD4+FoxP3-all+ (Upper) and CD4+FoxP3-E2+ (Lower) cells in NS healthy subjects; S healthy subjects; and COPD subjects at GOLD II, GOLD III, and GOLD IV stages. Data are from at least n = 3 subjects, and are expressed as mean ± SEM. Each symbol represents an individual healthy or COPD subject as indicated. *P < 0.05; **P < 0.01 by 2-tailed Mann–Whitney test.

