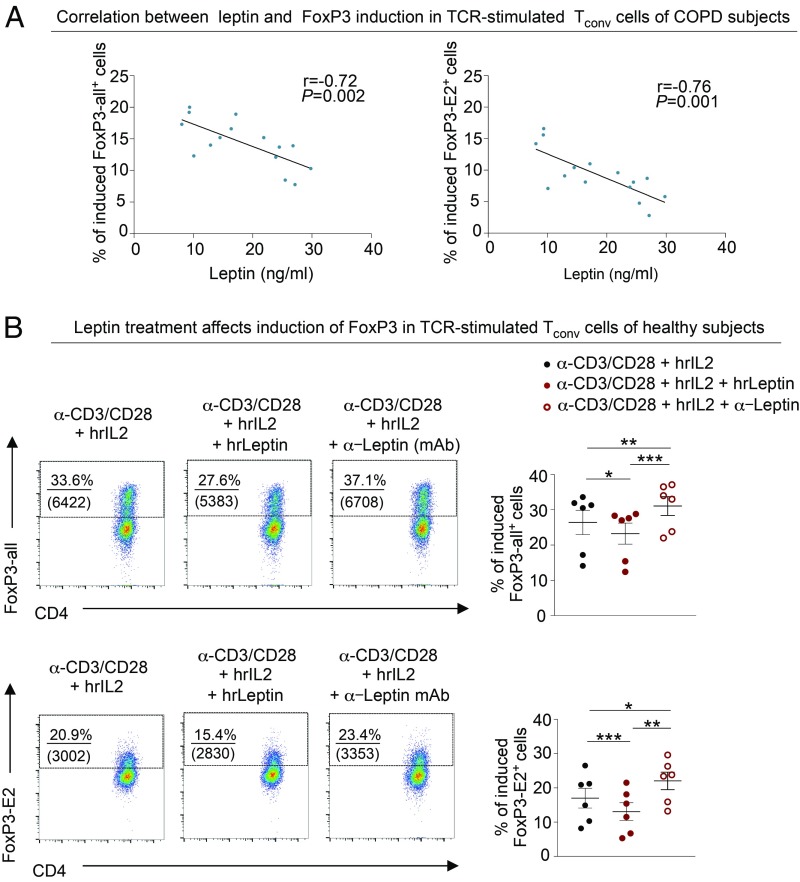
Fig. 8.
Leptin inversely correlates with FoxP3 expression and inhibits its induction in vitro. (A) Negative correlation between induction of FoxP3-all (Left) or FoxP3-E2 (Right) in TCR-stimulated Tconv cells and leptin levels. Data are from n = 15 COPD subjects. r = −0.72, P = 0.002 and r = −0.76, P = 0.001 by Pearson’s correlation. (B, Left) Representative flow cytometry plots show the percentage of induced FoxP3-all+ (Upper) and FoxP3-E2+ (Lower) cells, generated from Tconv cells of healthy subjects (in autologous donors, 5% plasma) stimulated for 10 d with α-CD3/CD28 plus human recombinant IL-2 (hrIL-2), in the presence of exogenous chronic hrLeptin (200 ng/mL) or in the presence of neutralizing α-Leptin (20 ng/mL) mAb. Numbers in the plots indicate the percentage of positive cells, and numbers in parentheses indicate mean fluorescence intensity of the marker. (B, Right) Cumulative data of percentage of induced FoxP3-all+ (Upper) and FoxP3-E2+ (Lower) cells, generated as above. Data are from n = 6 healthy subjects, and each point represents an individual healthy subject. *P < 0.05; **P < 0.01; ***P < 0.001 by paired repeated-measure 1-way ANOVA corrected for multiple comparisons Tukey test.

