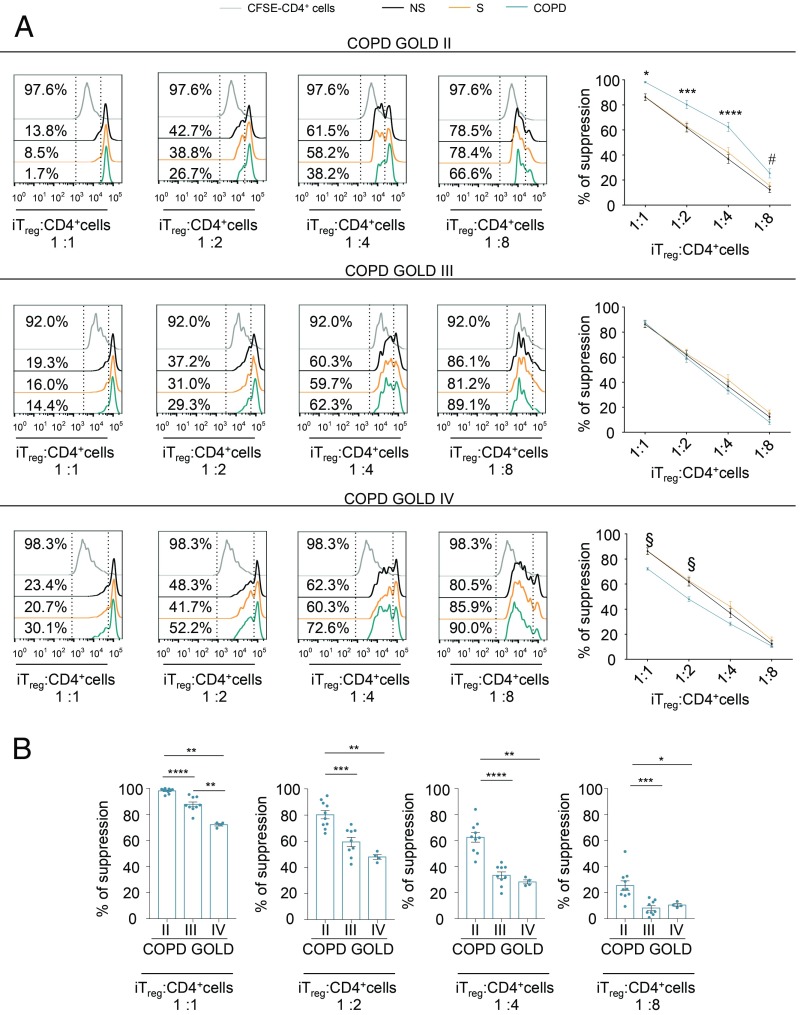
Fig. 9.
Suppressive function of iTreg cells declines with disease severity in COPD subjects. (A, Left) Flow cytometry histograms show proliferation of CFSE-labeled CD4+ T cells (from healthy donors) stimulated for 72 h in vitro with α-CD3/CD28 and cultured alone (gray curves) or in the presence of various numbers of flow-sorted iTreg cells (ratio from 1:1 to 1:8) from NS healthy subjects, S healthy subjects, and COPD patients at different disease stages. Numbers in plots indicate the percentage of CFSE dilution in CD4+ T cells cultured alone (Upper) or in the presence of iTreg cells from NS, S, and COPD subjects at different disease stages. The iTreg cells were flow-sorted as reported in the experimental procedure (SI Appendix, Fig. S13). (A, Right) Percentage of suppression exerted by iTreg cells in the above conditions. Data are from n = 3 independent experiments (at least n = 2 subjects in 2 technical replicates), and are expressed as mean ± SEM. *P < 0.05; ***P < 0.001; ****P < 0.0001 statistical significance between COPD at GOLD stage II and healthy (NS and S) controls. #P < 0.05 statistical significance between COPD patients at GOLD stage II and NS subjects by 2-way ANOVA corrected for multiple comparisons Tukey test. §P < 0.05 statistical significance between COPD patients at GOLD stage IV and S subjects by 2-way ANOVA corrected for multiple comparisons Tukey test. (B) Scatter plots with bar histograms show comparison of suppression ability exerted by iTreg cells (at the indicated ratio) isolated from COPD subjects on proliferation of CFSE-labeled CD4+ T cells stimulated for 72 h in vitro with α-CD3/CD28. Data are from n = 3 independent experiments (at least n = 2 COPD subjects in 2 technical replicates), and are expressed as mean ± SEM. *P < 0.05; **P < 0.01; ***P < 0.001; ****P < 0.0001 by 2-tailed Mann–Whitney test.

