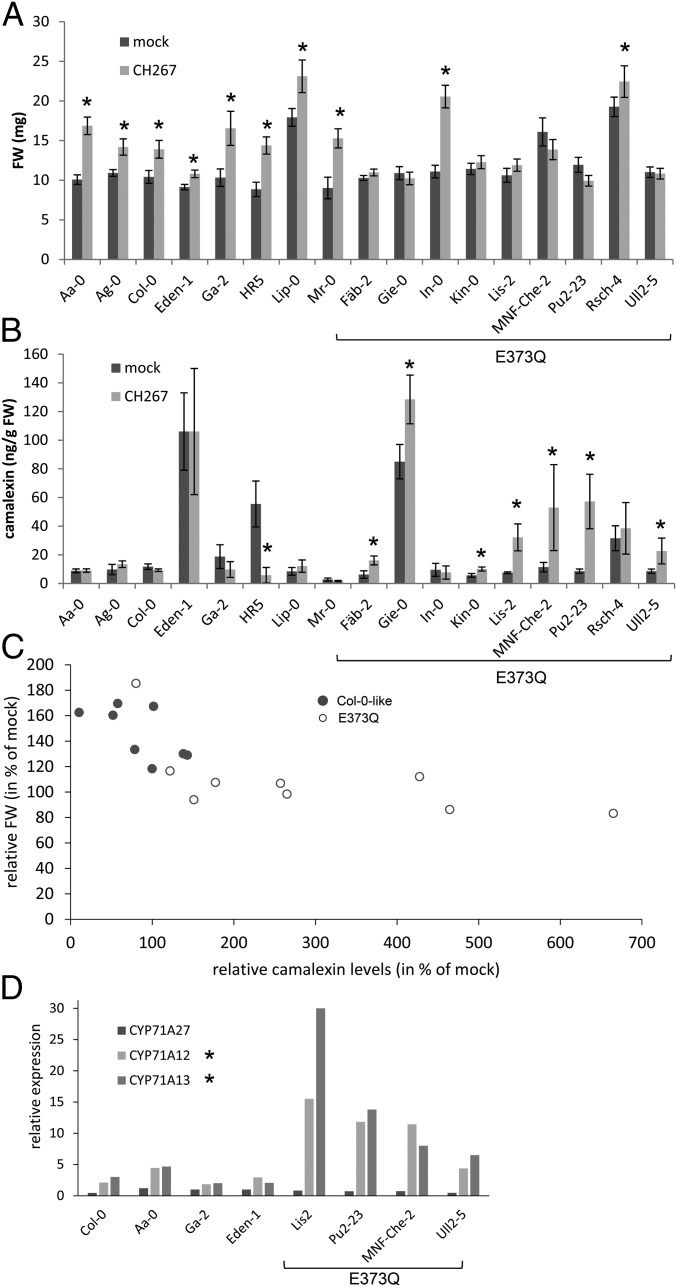
Fig. 6.
Natural variation in CYP71A27 affects plant microbe interaction. Eight or nine representative accessions with the 2 CYP71A27 haplotypes were grown for 2 wk in presence of 10 µM MgCl2 as mock treatment or Pseudomonas sp. CH267. (A) The FW of the whole plants was measured. Data are presented as means and SE from at least 20 plants grown on 4 independent plates. Asterisks indicate significant differences between Pseudomonas and mock treatments at P < 0.05 (Student’s t test). Three-way ANOVA revealed that FW of the plants depends on ecotype (P = 2 × 10⁻¹⁶), treatment (P = 8.2 × 10⁻¹⁴), haplotype:treatment (P = 4.7 × 10⁻⁶), and ecotype:treatment (P = 1.5 × 10⁻⁶). (B) Camalexin content in the roots was determined by HPLC. Data are shown as means and SD from 3 independent pools of at least 10 plants. Asterisks indicate significant differences between Pseudomonas and mock treatments at P < 0.05 (Student’s t test). Kruskal–Wallis test revealed that the camalexin levels depend on ecotype (P = 2.6 × 10⁻⁷), treatment (P = 0.28), and haplotype (Col-0-like or E373Q, P = 0.00066). (C) The relative FW after cocultivation with Pseudomonas sp. CH267 was plotted against relative camalexin levels for the different genotypes. (D) RNA was isolated from roots of 4 accessions from each haplotype. Expression of CYP71A27, CYP71A12, and CYP71A13 was determined by qPCR in 3 independent pools of 4 roots for each accession and treatment. Shown are the ratios of transcript levels between roots cocultivated with Pseudomonas sp. CH267 and mock treated roots. The asterisks denote significant differences in the up-regulation levels between the 2 haplotypes at P < 0.05 (Student’s t test).

