Fig. 2.
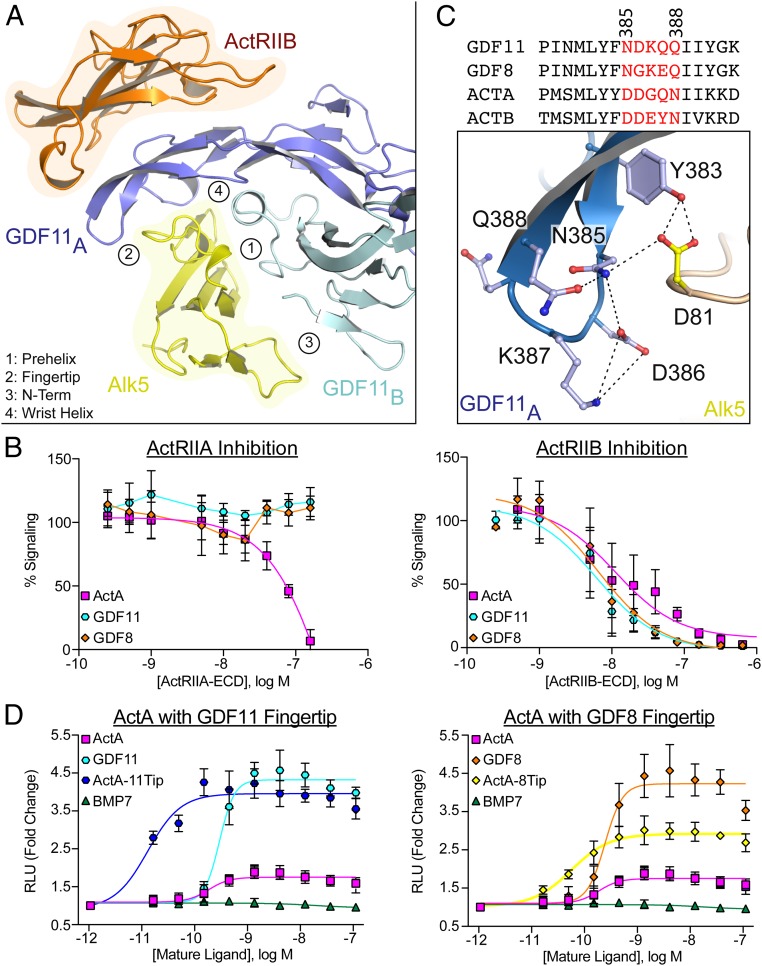
Differences in receptor specificity for the activin class. (A) Ribbon representation of one half of the GDF11/ActRIIB/Alk5 complex with GDF11/Alk5 interfaces numbered and labeled accordingly. (B) Inhibition curves (CAGA-luciferase) for respective ligands following the titration of the ECD of ActRIIA (Left) or ActRIIB (Right). (C) Sequence alignment of activin class ligands with fingertip residues represented in red. Numbers correlate to residues in GDF11. Specific molecular interactions between the GDF11 fingertip and the Alk5 β4–β5 loop highlighting the formation of a hydrogen bonding network with dashed lines. (D) Split β-galactosidase dimerization assay (DiscoverX) specific for ActRIIB/Alk5 assembly. For B and D, each data point represents the mean ± SD of triplicate experiments measuring relative luminescence units (RLU) (B) or β-galactosidase activity (D). For B, 100% signaling represents uninhibited signaling of each respective ligand.

