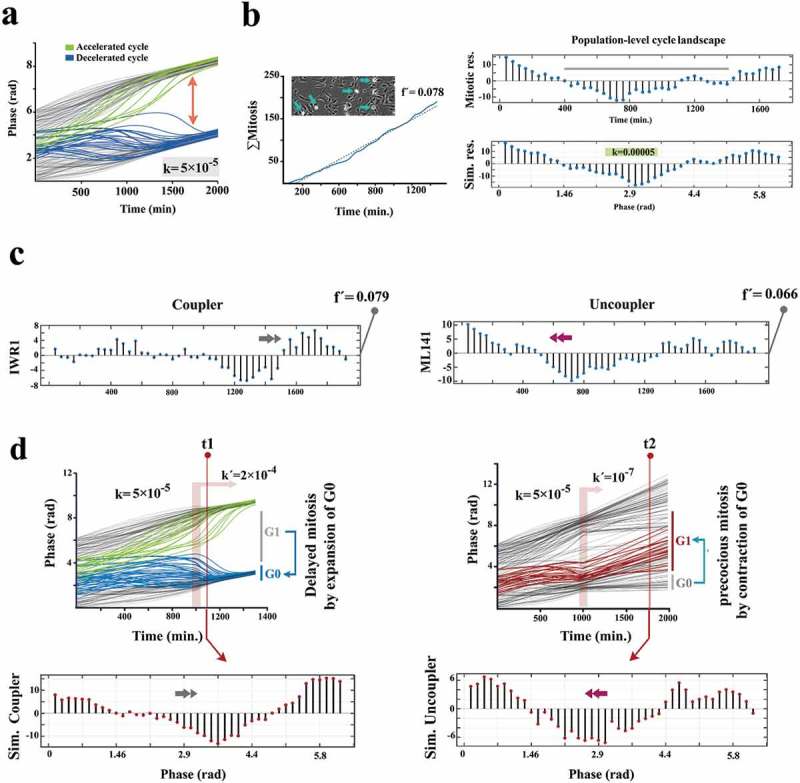
Figure 3.

Kuramoto model accurately predicts coupling dynamics of the cycling neural progenitors.
(a) Simulated emergence of synchronized cell divisions under instruction from a weak coupler. Phase angle (y-axis) represents the progress of progenitor cells (n =150 cells) through an abstract cell cycle with reference to the forthcoming mitosis that occurs at phase angle = 2Π (see methods for details). As such, the coupler instructs emergence of complete phase locking (full synchronization) at t = 1300 min. from the random distribution of phase angles (uncoupled/non- synchronized state) at t = 0. In this timeframe, the partial synchronization that occurs at t = 700 is compatible with the in vitro synchronization signature of progenitor cells. (b)The left panel shows the cumulative incidence of cell division (blue line) and the associated regression line (dotted grey line, fˊ = slope of the regression line). Phase contrast image shows an example of synchronized divisions (blue arrows) that generate positive deviations of mitotic incidence from linearity. Such deviations from linearity of cell division (mitotic residuals: mitotic res.) are in vitro signatures of coupled cycling (top right). The in vitro signature is accurately simulated by Kuramoto model of synchronization (bottom right, t = 700 as explained in part a). (c) Representative temporal signatures of mitotic synchronicity subsequent to increased (IWR1) and decreased (ML141) stringency of coupling were developed by application of inhibitors at a concentration of 100 nM (see methods). (d) Simulated emergence of synchronicity after increased (top left) and decreased (top right) coupling stringency that occurs at t = 1000 min (pink ribbon, kˊ indicates the altered coupling constant). The synchronicity profiles compatible with the in vitro signatures were observed at t1 (100 min. after the enhanced coupling) and t2 (750 min. after uncoupling). Biological interpretations of the simulated profiles of synchronicity are found next to the emergence plots.
