
Figure 5.
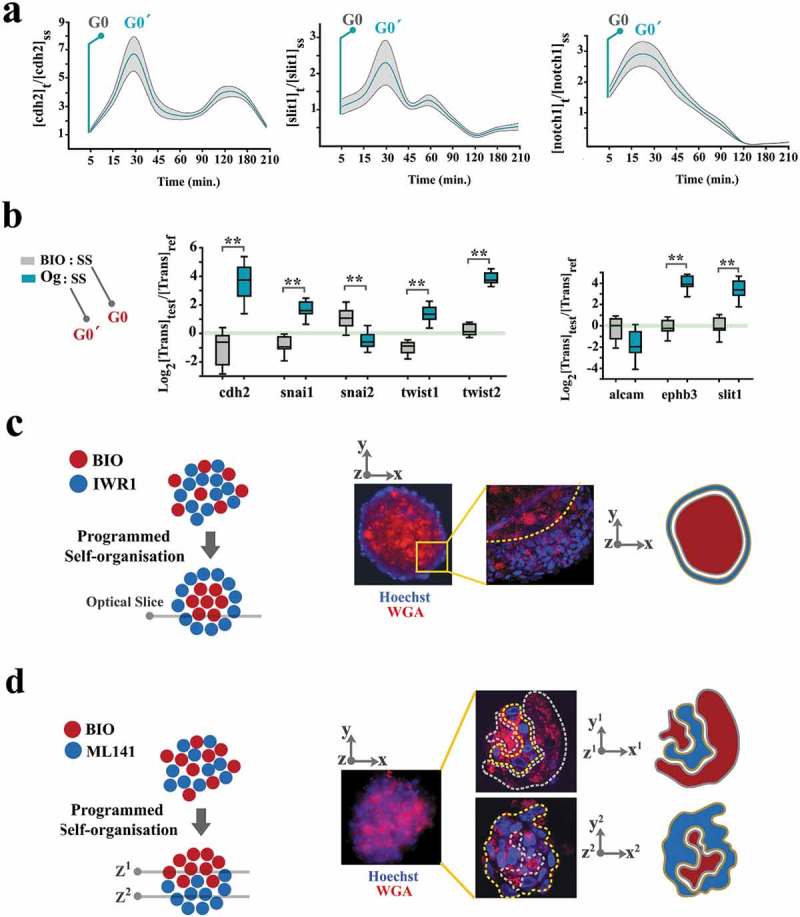
Spatial self-organization of organoids is programmed by coupling dynamics of the population.
(a) To uncover cell cycle-mediated modulation of intercellular communication cues, cells were initially synchronized at G0 by serum starvation and forced into G1 by adding serum. Graphs demonstrate the levels of gene expression normalized to t0 (serum starvation) (n = 3 biological replicates). Turquoise line: mean value, grey ribbon: ±SEM. (b) Box plots demonstrate the levels of expression genes that regulate intercellular communication cues in neural organoids (Og) and BIO+ cells, both normalized to cells in a serum-starved mode (SS) for 24 h. Note that organoid cells (synchronized at G0ˊ) express a higher level of these transcripts analogous to t = 30 min in part a when cells progress into G0ˊ from G0 by addition of serum to the starved cells. (c)A representative organoid shows the radial organization of BIO+ and IWR1+ cells. Wheat germ agglutinin-Alexa594 was used to label BIO-treated cells and Hoechst labeled the cells treated with IWR1 (top left scale bar: 100μm, top right scale bar: 25μm). High magnification image (right image) shows an optical slice of the organoid captured using confocal microscopy. (d)A representative organoid shows the polarised organization of BIO+ and ML141+ cells. Wheat germ agglutinin- Alexa594 was used to label BIO- treated cells and Hoechst labeled the cells treated with ML141 (top left scale bar: 100μm, top right scale bar: 50μm). High magnification image (right image) shows two optical slices of the organoid (1: top, 2: bottom of the organoid) captured using confocal microscopy.