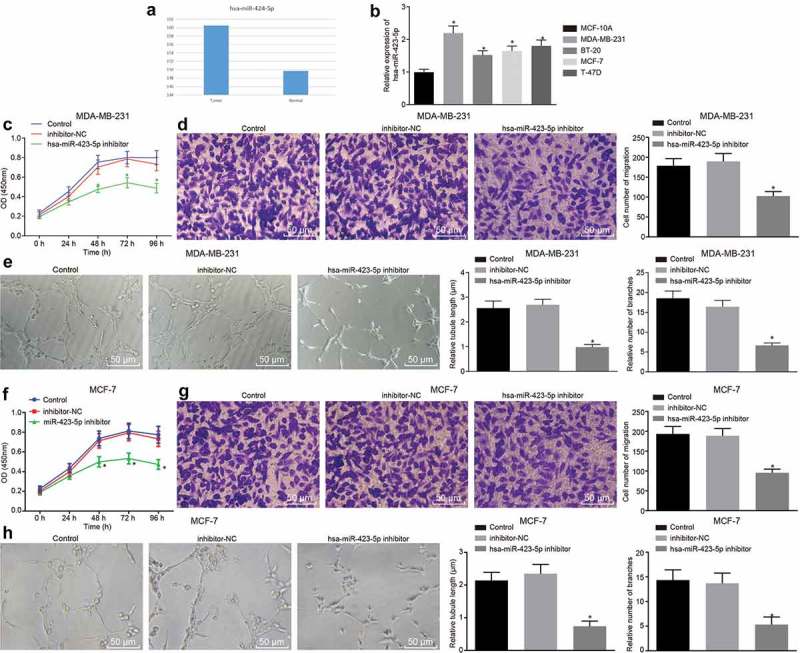
Figure 3.

Down-regulation of hsa-miR-423-5p inhibits the proliferation, migration and angiogenesis of BC cells. (a), the expression of hsa-miR-423-5p in BC samples and normal samples in TCGA from Tumor-miRNA-Pathway database. (b), the expression of hsa-miR-423-5p in BC cell lines relative to MCF-10A cells determined by RT-qPCR. (c), viability of MDA-MB-231 cells after inhibition of hsa-miR-423-5p evaluated by CCK-8 method. (d), the migration ability of MDA-MB-231 cells after down-regulation of hsa-miR-423-5p assessed by Transwell assay (200 ×). (e), tube length and number of branches in HUVECs co-cultured with MDA-MB-231 cells after inhibition of hsa-miR-423-5p determined by tube formation assay (200 ×). (f), viability of MCF-7 cells after inhibition of hsa-miR-423-5p evaluated by CCK-8 method. (g), the migration ability of MCF-7 cells after down-regulation of hsa-miR-423-5p assessed by Transwell assay (200 ×). (h), tube length and number of branches in HUVECs co-cultured with MCF-7 cells after inhibition of hsa-miR-423-5p determined by tube formation assay (200 ×). * p < 0.05, vs. MCF-10A cells, the control group (cells without treatment) or the inhibitor-NC group (cells transduced with anti-NC). The measurement data were expressed as mean ± standard deviation. One-way ANOVA was used for comparison among multiple groups, followed by Tukey’s post hoc test. Repeated measurement ANOVA was used for data comparison at different time points, followed by Dunnett’s post hoc test. The experiment was repeated three times.
