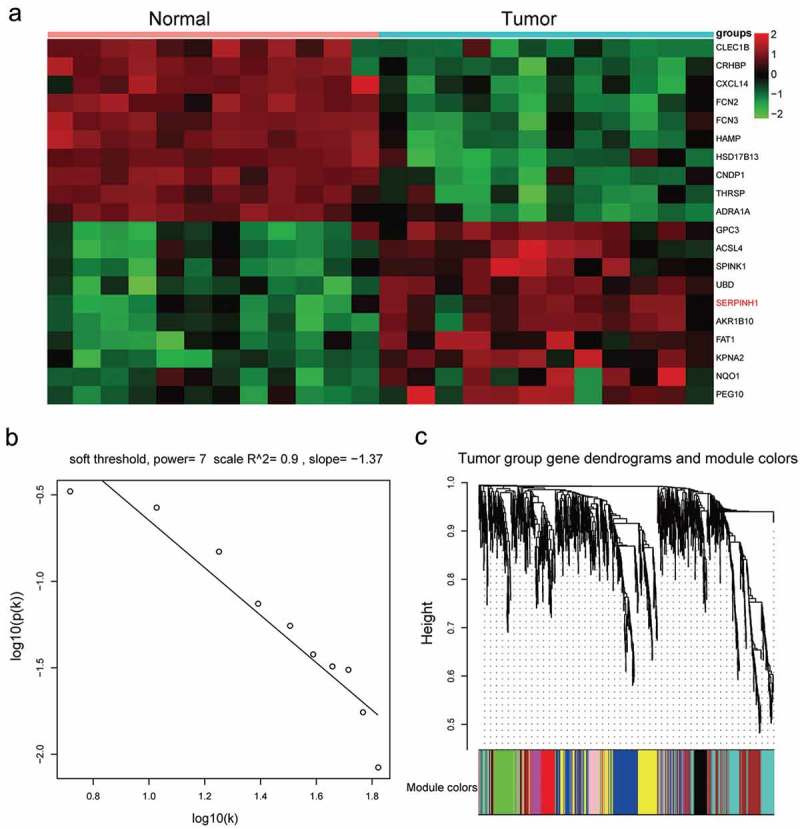
Figure 1.

SERPINH1 was up-regulated in HCC tissues. (a) Heatmap diagram generated by unsupervised clustering analysis with differentially expressed mRNAs in 12 paired HCC tissues and adjacent normal tissues. (b) Log-log plot of whole-network connectivity distribution. The x-axis showed the logarithm of whole network connectivity, y-axis showed the logarithm of the corresponding frequency distribution. On this plot, the distribution approximately followed a straight line, which is referred to an approximately scale-free topology. (c) Hierarchical cluster dendrogram derived from all the differentially expressed genes (DEGs) defined nine modules. Different colors below the diagram represented different modules.
