Figure 3.

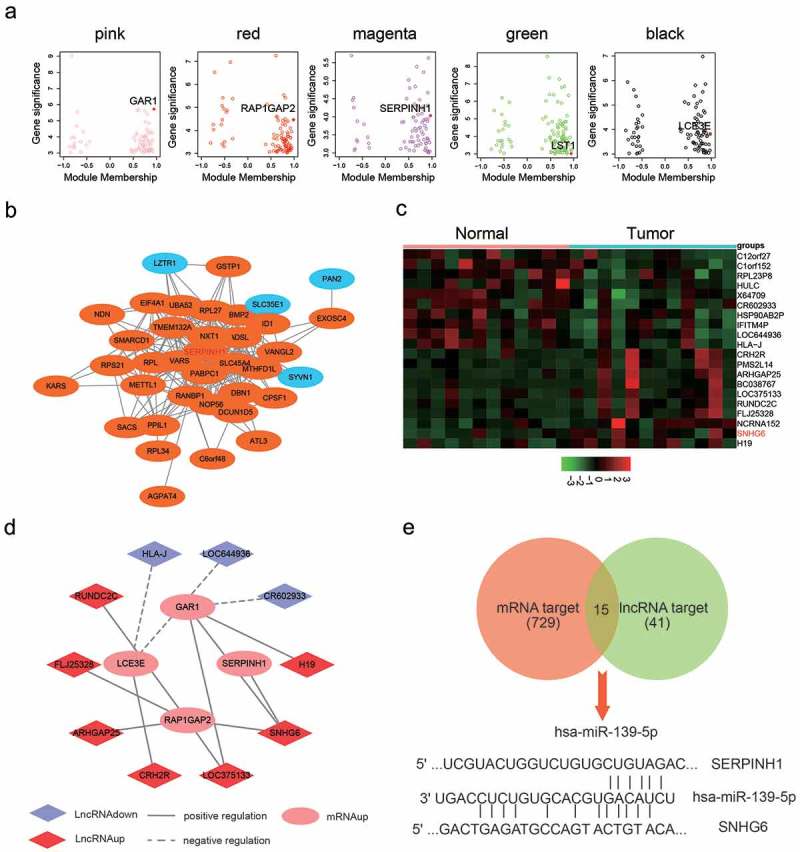
Co-expression network between mRNAs and lncRNAs. (a) The hub genes corresponding to each module were identified, especially SERPINH1 is the hub gene in the magenta module. (b) PPI of genes in the magenta module, red color one represents the high expression, blue one represented a low expression. (c) Heat map diagram generated by unsupervised clustering analysis with 12 pairs differentially expressed lncRNAs in HCC tissues and adjacent normal tissues. (d) Co-expression of SNHG6 and SERPINH1. Up-regulated mRNA was indicated to pink circle, up-regulated lncRNA was indicated to red Rhombus and down-regulated lncRNA was indicated to light purple Rhombus. (e) 15 miRNAs that possessed possibly targeted relationships with mRNAs and lncRNAs were determined by Venn diagram.
