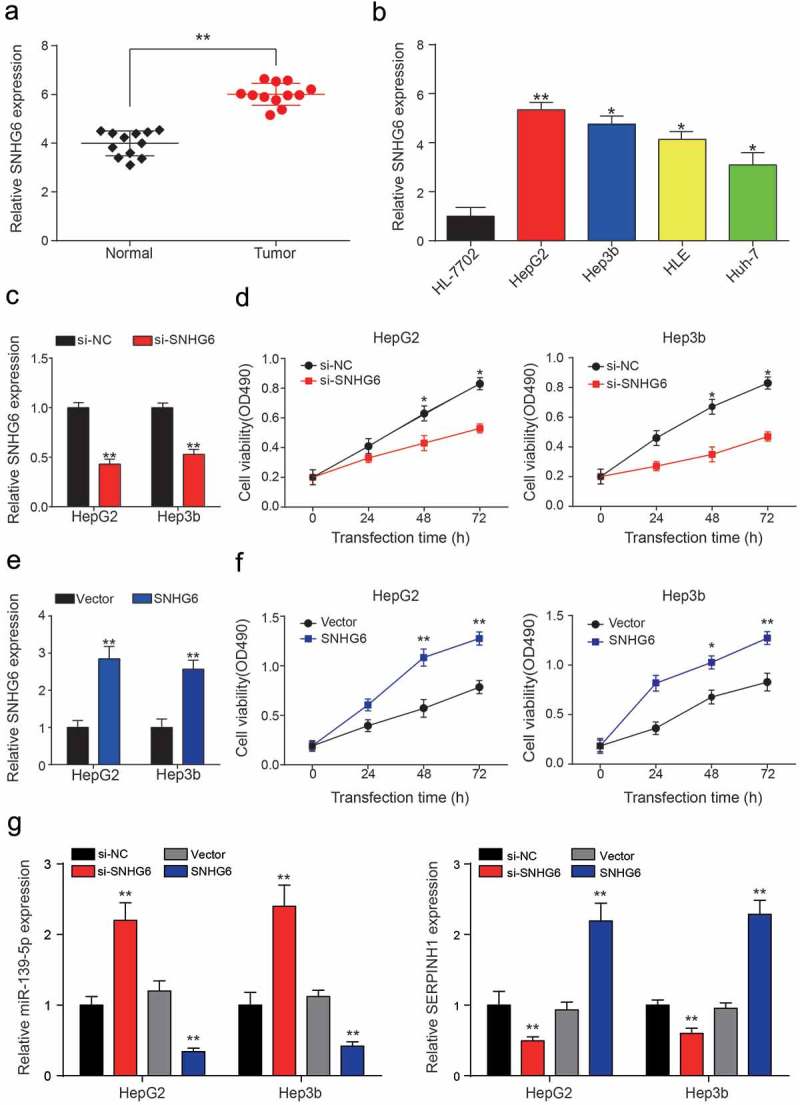
Figure 4.

SNHG6 was highly expressed in HCC cells. (a) SNHG6 was significantly higher expressed in HCC tissues compared with adjacent normal tissues, expression levels were calculated from the gene/β-actin expression ratio (**P< 0.01, compared with a normal group). (b) SNHG6 expression level in one normal liver cell line: HL-7702 and four HCC cell lines: HepG2, Hep3b, HLE and Huh7. (*P< 0.05, **P< 0.01, compared with HL-7702 group) (c) QRT-PCR showed SNHG6 expression levels in HepG2 and Hep3b cell lines were down-regulated by si-SNHG6. (**P< 0.01, compared with a si-NC group, respectively) (d) Cell viability of two HCC cell lines was analyzed by MTT assay. The inhibition of SNHG6 can significantly decrease the cell viability compared with the NC group. (*P< 0.05, compared with a si-NC group, respectively) (e) QRT-PCR showed SNHG6 expression levels in HepG2 and Hep3b cell lines were up-regulated by pcDNA3.1-SNHG6. (**P< 0.01, compared with Vector group, respectively) (f) MTT assay exhibited pcDNA3.1-SNHG6 can significantly increase the cell viability compared with the vector group. (*P< 0.05, **P< 0.01, compared with Vector group, respectively) (g) Down-stream miR-139-5p and SERPINH1 expressions in different transcription groups were detected by QRT-PCR (**P< 0.01, compared with si-NC or Vector group, respectively). Every experiment was performed for 3 times at least.
