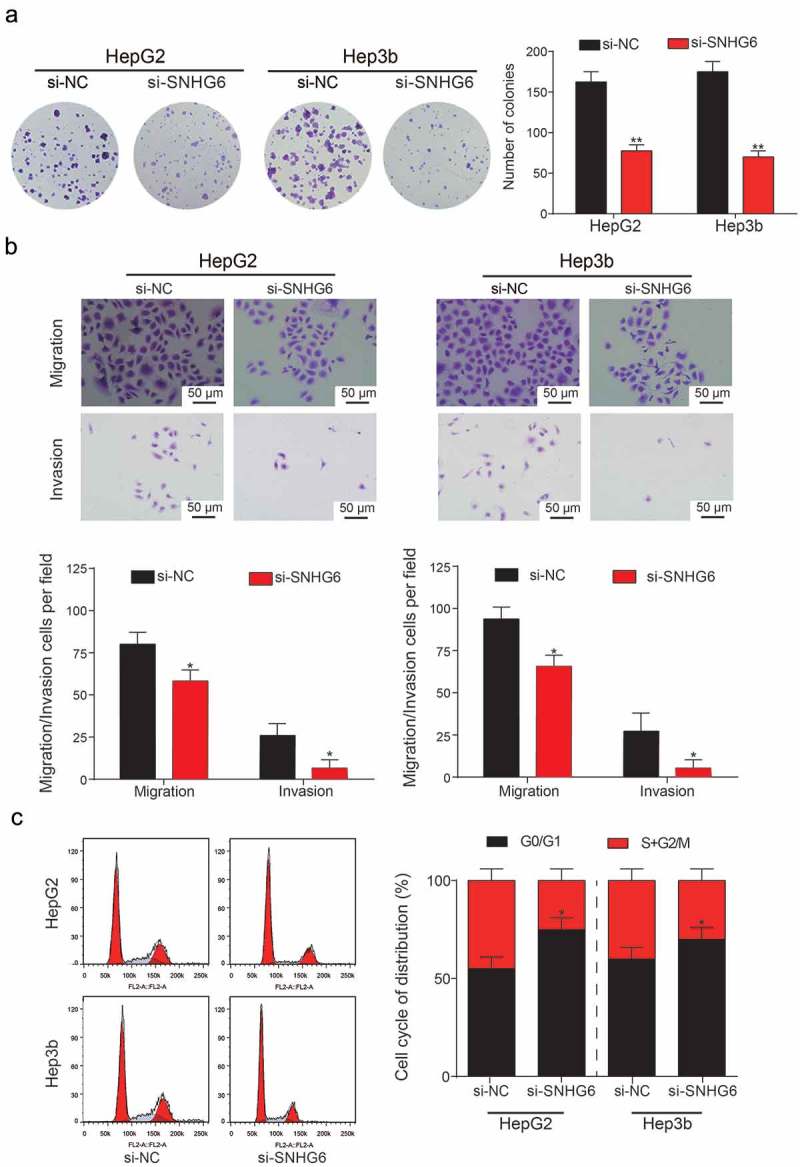
Figure 5.

Si-SNHG6 inhibited the proliferation and viability of HCC cells. (a) Colony numbers in the si-SNHG6 group and the si-NC group were counted and compared. Knockdown of SNHG6 showed a significant decrease in the number of HCC cells. (**P< 0.01, compared with the si-NC group) (b) Migration and invasion rate of HepG2 and Hep3b cells in different transfection groups, the migration cells and invasion cells per field suggest the migration and invasion rate of cells. (*P< 0.05, compared with a si-NC group) (c) Flow cytometry analysis of the cell cycle phase distribution. Representative cell cycle analysis (left panel). Results are represented as mean ± SD (*P< 0.05, compared with a si-NC group). Every experiment was performed for 3 times at least.
