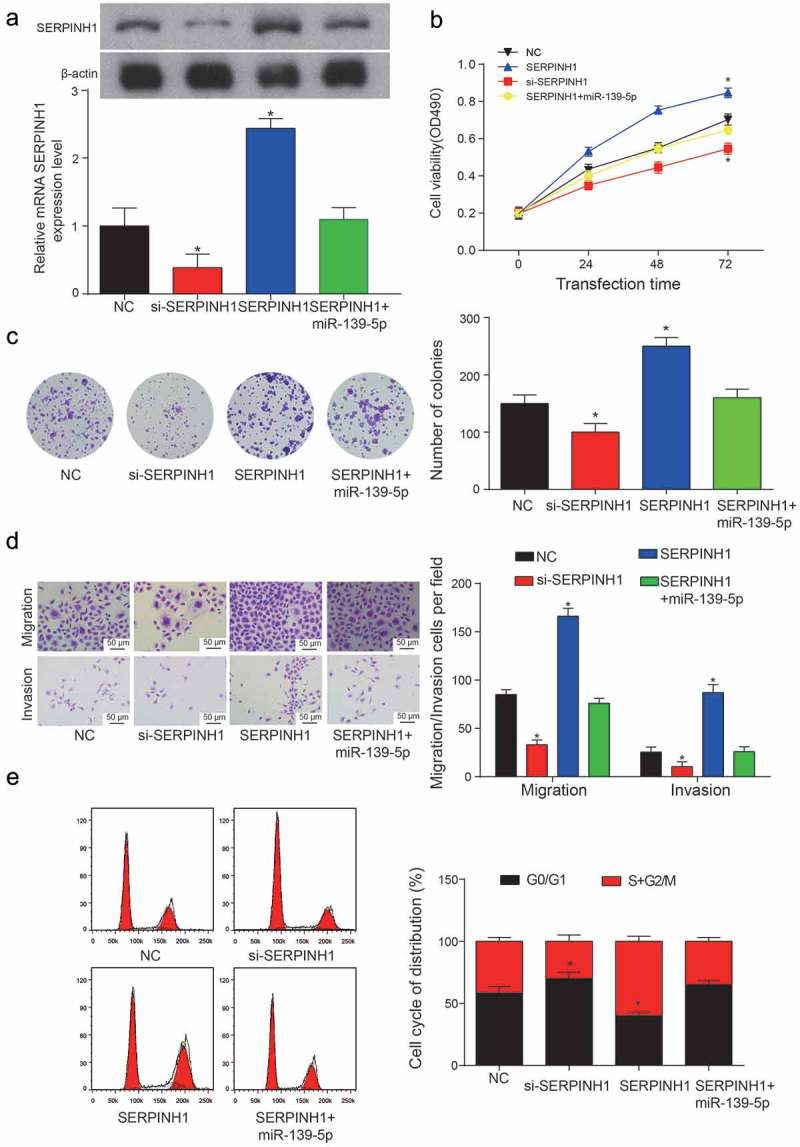
Figure 10.

SERPINH1 promoted the proliferation and viability of HCC cells. (a) Relative expression levels of SERPINH1 in NC group, si-SERPINH1 transfection group, SERPINH1 group and SERPINH1+ miR-139-5p transfection group (*P< 0.05, compared with NC group). (b) Cell viability of HepG2 cell line was analyzed by MTT assay. (*P< 0.05, compared with NC group) (c) Colony numbers were counted and compared between three transfection groups and NC group. The inhibition of SERPINH1 showed a significant decrease in the number of HepG2 cells. (*P< 0.05, compared with NC group) (d) Migration and invasion rate of HepG2 cells in different transfection groups, the migration cells and invasion cells per field suggest the migration and invasion rate of cells. (*P< 0.05, compared with NC group) (e) Cell cycle analysis of the cell cycle phase distribution was represented as mean ± SD (* means P< 0.05 compared to NC group). Every experiment was performed for 3 times at least.
