
Fig. 3. The free energy dependence of CPET rate constants showing the normal and inverted regions.
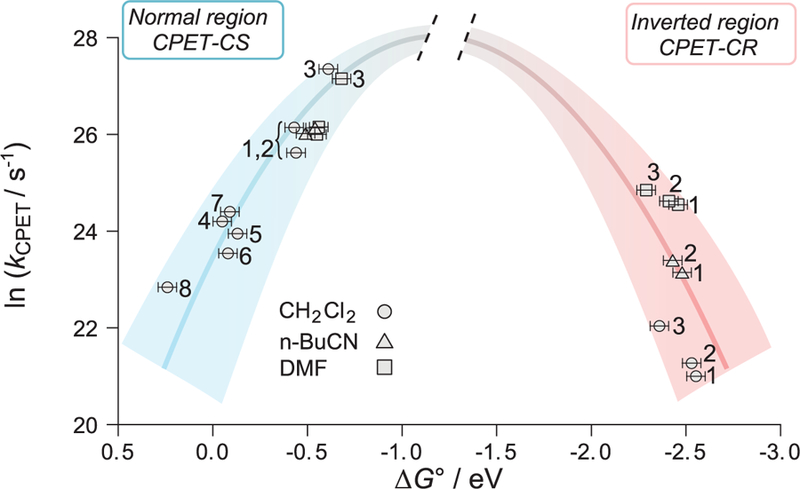
Plot of ln(kCPET) from TA versus computed ∆G° (17). Rising blue parabola: kCS (charge separation) in 1 to 8 versus ∆G°CS; falling red parabola: kCR (charge recombination) in 1 to 3 versus ∆G°CR. The uncertainties in kCPET are smaller than the data points. The uncertainties in ∆G° are estimated to be ±0.05 eV; the relative uncertainties for CPET-CR in 1 to 3 in the inverted region are smaller, as these differences arise solely from changes in the pyridine substituents.