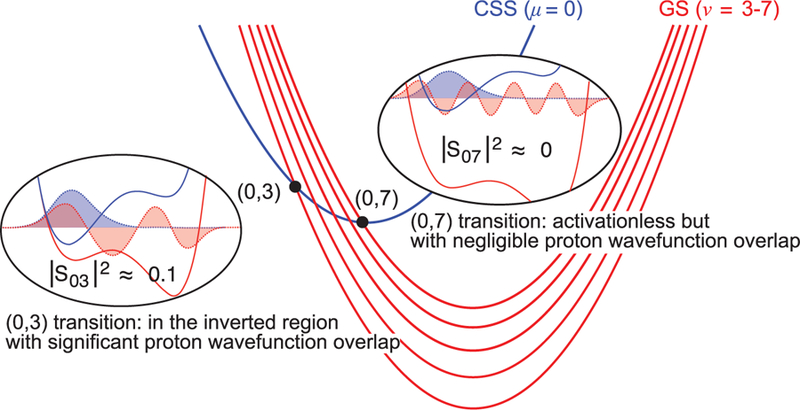
Fig. 4. Illustration of the lowest CSS (blue) and multiple product GS (red) vibronic state free energy curves for the CPET-CR reaction.

Nonadiabatic transitions can occur at the intersection points between the reactant (μ) and product (ν) parabolas (black dots). Circled diagrams show proton potential energy curves for the reactant (blue) and product (red) and the corresponding proton vibrational wave functions for a state pair with significant overlap integral (S03) and a state pair with near-zero overlap integral (S07) at the dominant proton donor-acceptor distance for 1.
