
Fig. 4. gntR mutants express a glycosyl hydrolase that alters lipoteichoic acid.
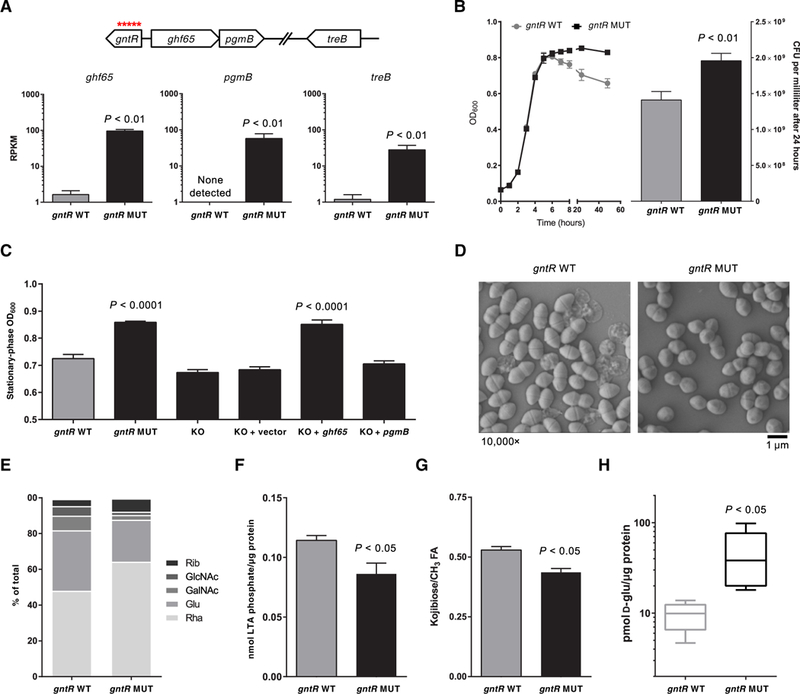
(A) RNA sequencing of isogenic gntR wild-type (WT) and mutant (MUT) E. faecalis strains. Reads per kilobase per million mapped reads (RPKM) are shown for the three genes that constitute the gntR regulon. Genomic context of the genes is shown above. (B) Growth curves for gntR WT and MUT strain are shown on the left. Colony-forming units (CFU) per milliliter for gntR WT and MUT strains, which were enumerated after 24 hours of culture by dilution plating, are shown on the right. (C) Optical densities (OD600) in the stationary phase of growth for gntR WT and MUT strains and for isogenic gntR MUT strain derivatives in culture are shown. KO, knockout strains. (D) Scanning electron micrographs of gntR WT and MUT E. faecalis strains in culture. (E) Monosaccharide composition analysis of cell surface-associated polysaccharides isolated from gntR WT and MUT strains. Rha, rhamnose; Glu, glucose; GalNAc, N-acetylgalactosamine; GlcNAc, N-acetylglucosamine; Rib, ribose. (F) Total lipoteichoic acid (LTA) isolated from gntR WT and MUT stationary-phase cultures. Lipoteichoic acid was quantified by measuring inorganic phosphate and was normalized to total protein in lysate. (G) Quantification of side-chain kojibiose per molecule of lipoteichoic acid. ‘h nuclear magnetic resonance spectroscopy peaks were integrated and normalized to fatty acid (FA) (−CH3) proton peaks. (H) Quantification of intracellular D-glucose in gntR WT and MUT strains, normalized to total protein, as quantified by a Bradford assay. Data in all panels except (D) and (E) show mean values of at least three biological replicates, with error bars showing SDs. All P values were calculated with a two-tailed t test.