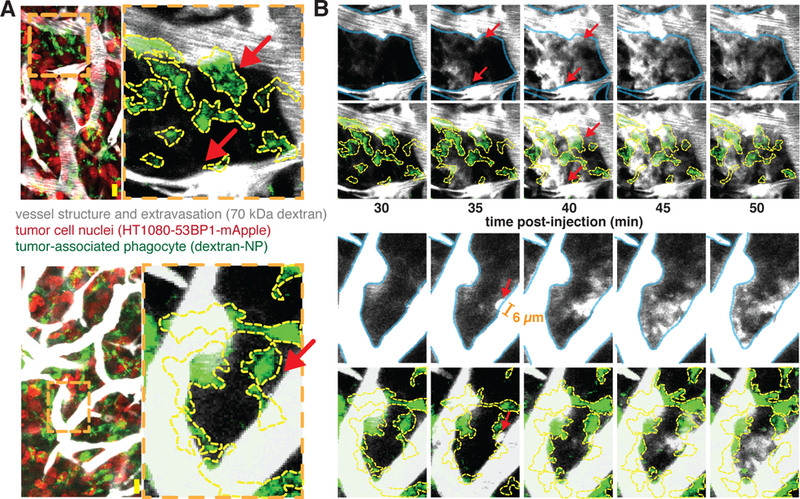
Figure 3. Tumor associated phagocytes co-localize with heterogeneous extravasation bursting.

3 days post-RT, tumors were imaged every 5 min after injection of fluorescent 70 kDa dextran (greyscale). a) Zoomed-in regions where bursting will occur (red arrows) are highlighted in two example images collected immediately after dextran injection to show vascular geometry and phagocyte co-localization. Orange dashed lines denote zoomed-in regions where bursts occur, and yellow lines outline phagocytes. b) Images of dextran extravasation in the example regions where bursting will occur shown over 50 minutes post-injection. Vessels (blue, top rows) and phagocytes (yellow, bottom rows) are outlined for context. In the bottom example, the orange bar marks the diameter of a pre-burst protrusion (6 μm). Scale bars, 20 μm.
