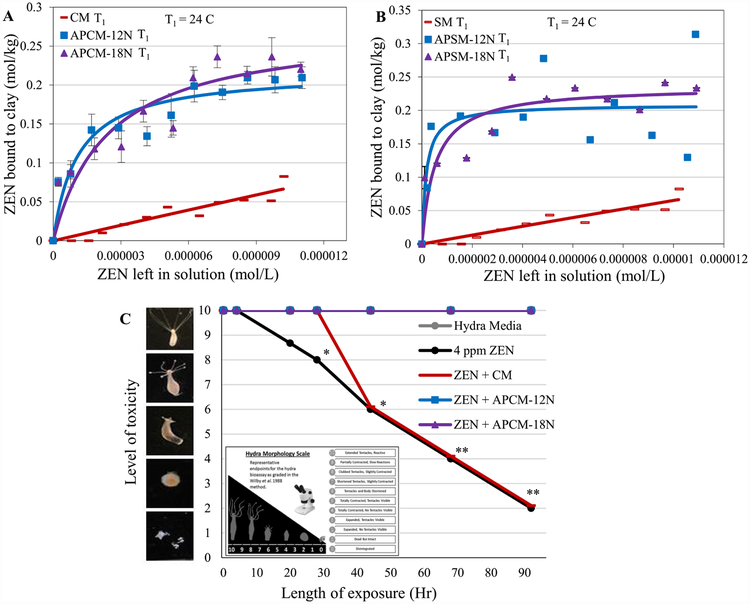
Figure 4.
Langmuir plots of ZEN on APCM (A) and APSM (B) versus parent clays showing the predicted Qmax values at 24 °C (T1). Hydra toxicity and protection by CM and APCM at 0.01% inclusion level against 4 ppm ZEN (C). Hydra media and toxin controls are included for comparison. The score of 10 (indicating no toxicity) contains the hydra media and both APCM treatments (*P ≤ 0.05, **P ≤ 0.01). The binding and affinity parameters are as follows: (A) APCM-12N T1: Qmax = 0.22; Kd = 1E6; APCM-18N T1,: Qmax = 0.28; Kd = 4E5. (B) APSM-12N T1. Qmax = 0.21; Kd = 6E6; APSM-18N T1. Qmax = 0.24; Kd = 2E6.

