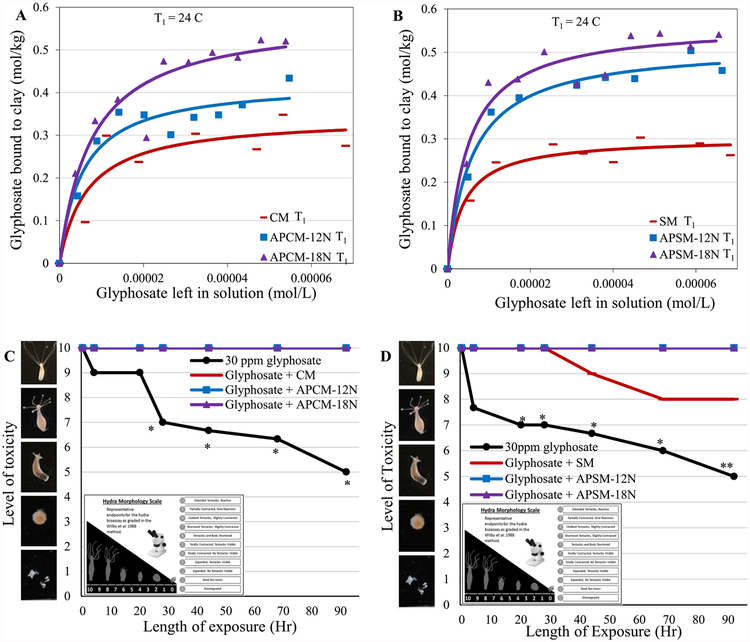
Figure 7.
Langmuir plots of glyphosate on APCM (A) and APSM (B) versus parent clays show the predicted Qmax values at 24 °C (T1). Hydra toxicity and protection by CM and APCM (C), and SM and APSM (D) at a 0.1% inclusion rate are shown against 30 ppm glyphosate. Hydra media and toxin controls are included for comparison. The score of 10 (indicating no toxicity) contains the hydra media and all clay treatment groups except SM (*P ≤ 0.05, **P ≤ 0.01). The binding and affinity parameters are as follows: (A) CM T1: Qmax = 0.34; Kd = 2E5; APCM-12N T1: Qmax = 0.42; Kd = 2E5; NSP-18N T1: Qmax = 0.58; Kd = 1E5. (B) SM T1: Qmax = 0.3; Kd = 3E5; APCM-12N T1. Qmax = 0.52; Kd = 2E5; NSP-18N T1. Qmax = 0.56; Kd = 2E5.

