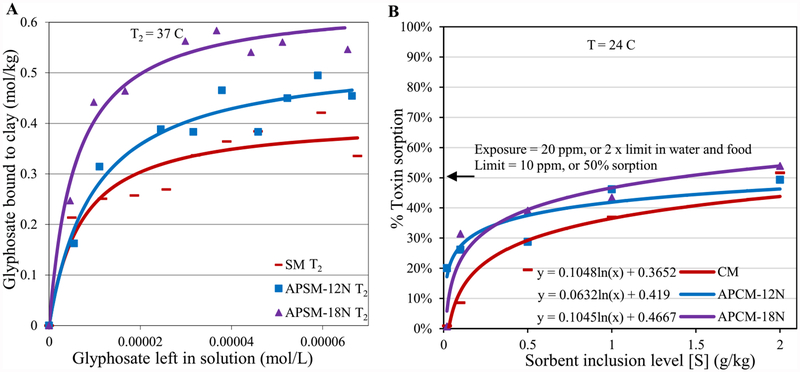
Figure 8.
Langmuir plots of glyphosate on APSM showing the predicted Qmax values at 37 °C (T2) (A). Extrapolation of sorbent dosimetry for glyphosate exposure (B). The binding and affinity parameters are as follows: (A) SM T2: Qmax = 0.26; Kd = 2E5; APSM-12N T2: Qmax = 0.53; Kd = 1E5; APSM-18N T2: Qmax = 0.6; Kd = 2E5.

