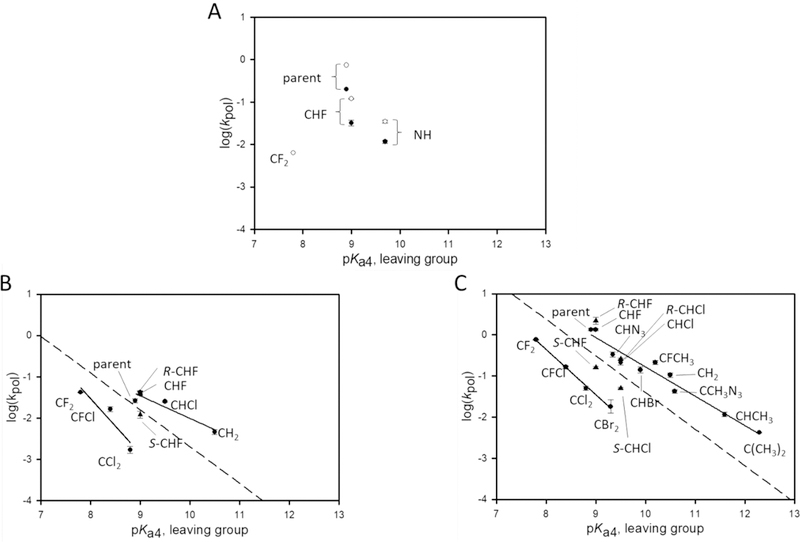
Figure 4.

LFER plots for G opposite T. Dashed lines correspond to the theoretical Brønsted line as described in the text. (A) Overlay of pol η plots for both sequences. Because the analogues are not well used by pol η, only three compounds were incorporated for the B sequence, parent, CHF, and NH. In addition to these three, CF2 was incorporated for the W sequence context. In each case, the W sequence resulted in a ~3-fold higher kpol, a marked difference from the correct incorporations (Figure 3A). (B) Pol λ with the B sequence. The slopes are −0.55 and −1.3 for the upper and lower LFER lines, respectively. (C) Pol β with the B sequence.7,8,10 The slopes of the lines are −0.71 (upper) and −1.1 (dihalo compounds).
