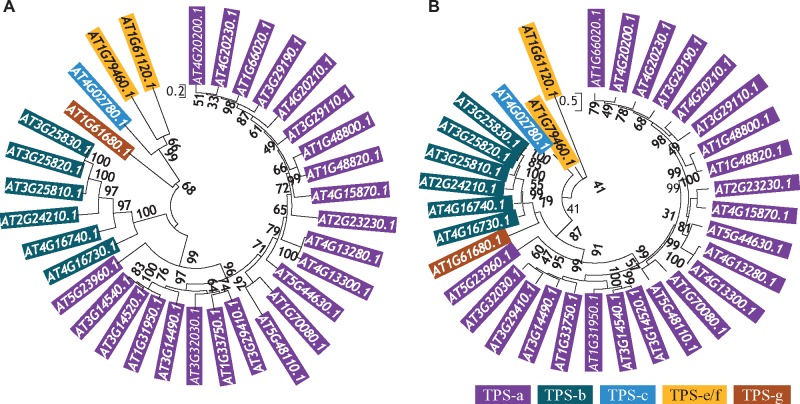
Fig. 2.
—Molecular phylogenetic analysis of TPSs in Arabidopsis by Maximum Likelihood method. The trees were constructed by the MEGA6 program according to the description in Materials and Methods. (A) and (B) showed the phylogenetic tree based on PF03936 and PF01397 domain sequences, respectively. The subfamilies highlighted by colors purple, benzo, blue, orange, and brown, indicate TPS-a, -b, -c, -e/f, and -g, respectively.

