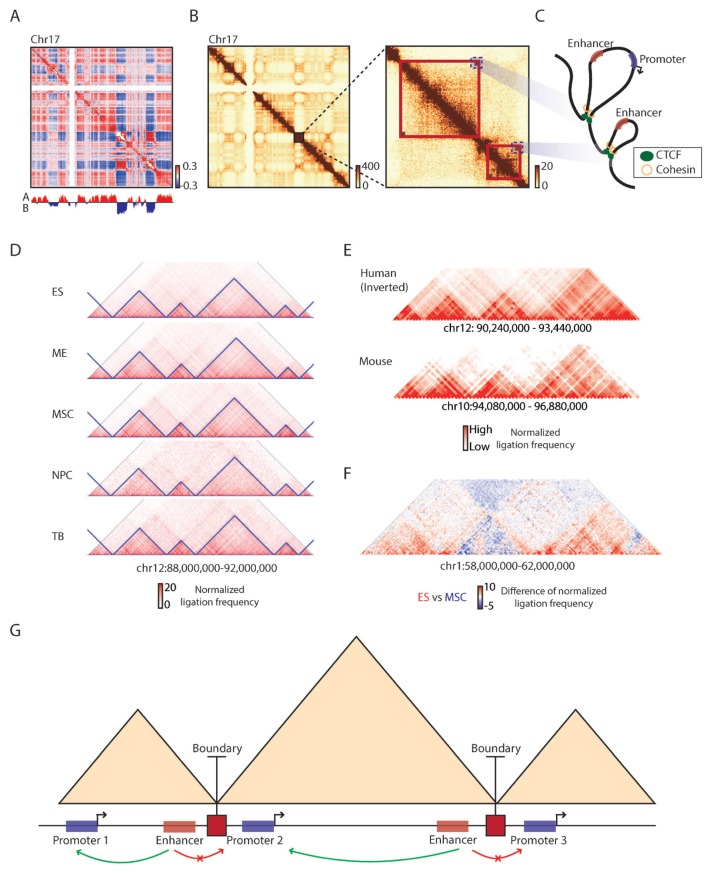
Fig. 1. Principles of topologically associating domains.
(A) A correlation matrix of Hi-C chromatin contact map of chromosome 17 showing plaid compartment A/B pattern (Pearson correlation coefficient, red: positive, blue: negative) with its first eigenvector (PC1 values) obtained from principal component analysis (PCA) analysis (bottom track, red: compartment A, blue: compartment B). (B) 500 kb resolution chromatin contact map of the same chromosome (left), along with a zoomed-in 40 kb resolution contact map showing structures of topologically associating domains (right, red boxes). Dark red color in contact maps indicates higher raw ligation frequency. (C) A schematic showing chromatin loops in the corresponding TAD regions (blue dotted boxes in Fig. 1B). Red boxes: enhancers, Blue boxes: promoters, Green circles: CTCF, Yellow rings: cohesin. (D) Conservation of TAD boundaries during cellular differentiation. ES: embryonic stem cells, ME: mesendoderm cells, MSC: mesenchymal stem cells, NPC: neural progenitor cells, TB: trophoblast-like cells. The blue triangles represent TADs. Red color in contact maps indicates higher normalized ligation frequency. (E) Conservation of TAD boundaries between human and mouse genomes. Red color in contact maps indicates higher normalized ligation frequency. (F) TAD-wise interaction changes observed between ES and MSC. Red color indicates higher normalized ligation frequency in the ES than the MSC and blue color indicates higher frequency in the MSC than ES. (G) A schematic showing enhancer-promoter interactions constricted by TAD boundaries (red squares). Red boxes: enhancers, Blue boxes: promoters, Green arrow arc: enhancer-promoter interactions, Red arrow arc: no enhancer-promoter interactions.

