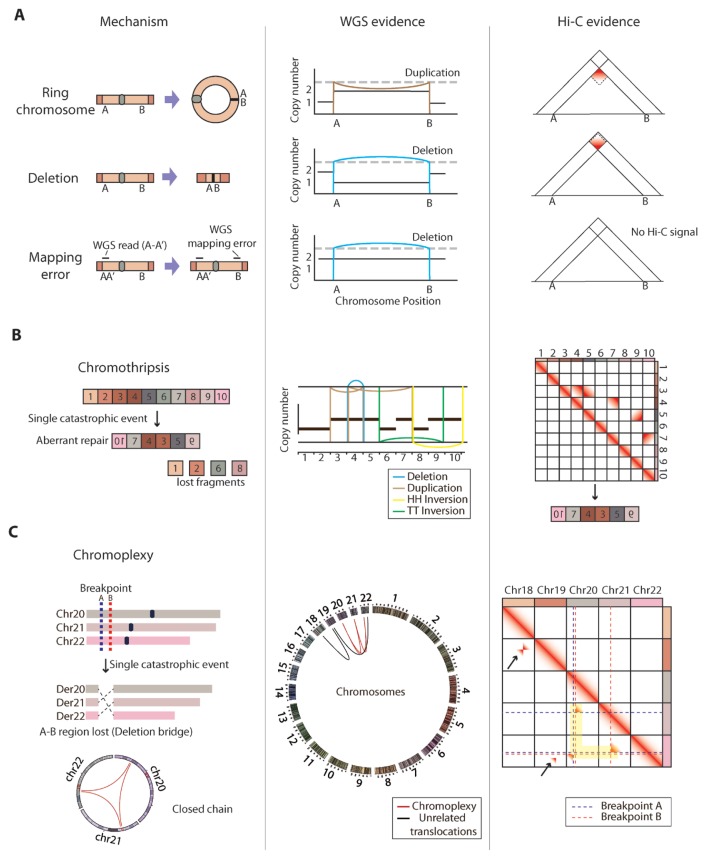
Fig. 4. Detection of complex structural variations with chromatin contact maps.
(A) Schematics showing the three possible cases generating paired-end reads spanning A and B regions in WGS: ring-shaped chromosome formation, very large deletion, and WGS mapping error (left). Shown are the corresponding DNA alteration patterns based on WGS data (middle) and gradient patterns in Hi-C chromatin interaction matrix that can distinguish the three cases (right). (B) Schematics showing the mechanism (left), WGS-based genomic rearrangement patterns (middle), and Hi-C chromatin interaction matrix with distinct gradient patterns that can be used to deduce rearranged genomic order (right) in chromothripsis. Color of the genomic rearrangement patterns (middle) indicates the types of the called SVs. (C) Schematics showing the mechanism (blue/red dotted lines are breakpoints) and circos plot showing the closed chain translocation pattern (red arc lines) of the chromoplexy event (left). Der: derivative chromosomes. A circos plot of all chromosomes shows both chromoplexy (red arc lines) and unrelated translocations (black arc lines) produced from WGS data (middle). Shown is Hi-C chromatin interaction matrix with gradient patterns aligned in breakpoint coordinate lines that can easily distinguish translocations involved in chromoplexy (highlighted in yellow) from unrelated translocations (black arrows) (left).

