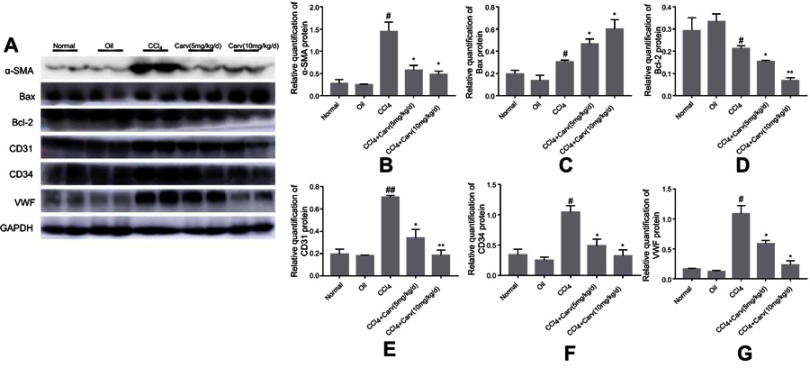
Figure 3.
Western blot analyses of α-SMA, Bax, Bcl-2, CD34, CD31 and VWF. (A) Protein expression bands of each index detected by Western blot. (B) The expression of α-SMA was significantly decreased after carvedilol treatment. #P<0.05 vs oil group; *P<0.05 vs CCl4 group. (C) The expression of Bax was increased after carvedilol treatment. #P<0.05 vs oil group; *P<0.05 vs CCl4 group. (D) The expression of Bcl-2 was decreased after carvedilol treatment. #P<0.05 vs oil group; *P<0.05 vs CCl4 group; **P<0.01 vs CCl4 group. (E) The expression of CD31 was decreased after carvedilol treatment. ##P<0.01 vs oil group; *P<0.05 vs CCl4 group; **P<0.01 vs CCl4 group. (F, G) The expression of CD34 and VWF was decreased after carvedilol treatment. #P<0.05 vs oil group; *P<0.05 vs CCl4 group.
Abbreviations: α-SMA, α-smooth muscle actin; CCl4, carbon tetrachloride; Carv, carvedilol; Bcl-2, B-cell lymphoma-2; VWF, von Willebrand factor.

