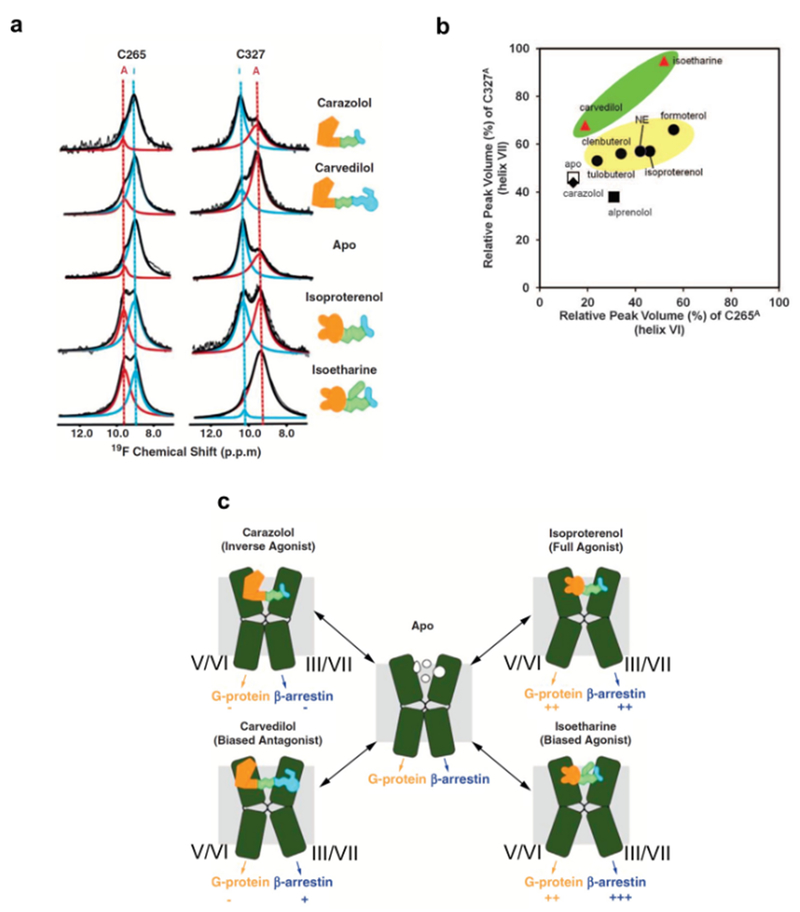
Figure 4 |. NMR-observable conformational equilibria related to biased signaling of β2AR.
a | 19F-NMR signals of CF3 probes attached to C265 and C327 in the apo-form and in four drug complexes of β2AR. The experimental spectra (thin black line showing noise) have been deconvoluted into signals of an active-like state (red, A) and an inactive state (blue, I) of β2AR. The thick black line represents the sum of the signals I and A. b | Plot of the relative peak volumes for an active-like state of β2AR observed at C265 (C265A) versus the relative peak volumes for an active-like state at C327 (C327A). The relative peak volumes are the ratios of the volume of peak A and the sum of the volumes of peaks A and I. The data for the complexes with the agonists tulobuterol, clenbuterol, norepinephrine (NE), isoproterenol, and formoterol are shown as black circles highlighted by a yellow background. The data with the biased ligands carvedilol and isoetharine are shown as red triangles highlighted by a green background. The data with the neutral antagonist alprenolol, the inverse agonist carazolol, and the apo state are shown as a black square, a black diamond, and an open square, respectively. c | Signaling intensities through two β2AR pathways suggested by the 19F-NMR experiments. TMVI and TMVII of β2AR are shown as green kinked cylinders. The structures of the four bound ligands are schematically drawn (yellow, green, and cyan) and their functionalities are indicated. The arrows at the lower end of the cylinders indicate the signaling to the downstream effectors, with plus and minus signs indicating the signaling levels relative to the basal state.

