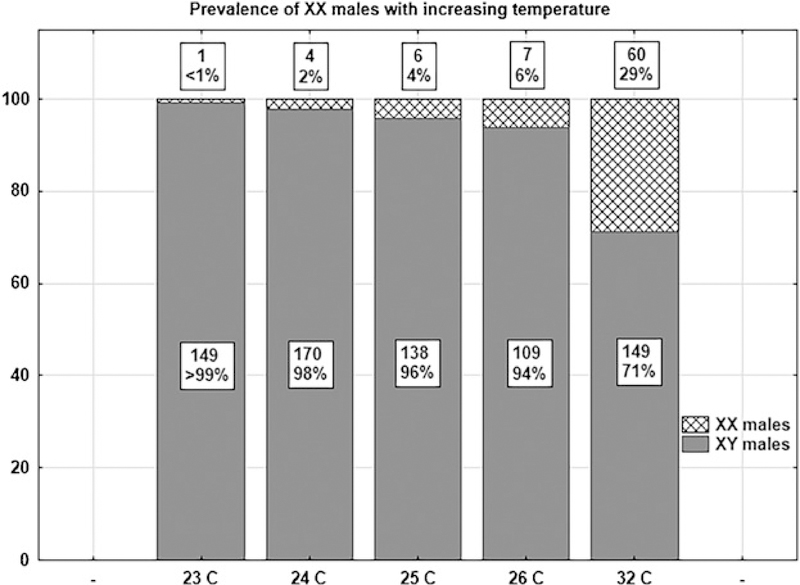
Figure 7.
Prevalence, as a percentage, of XX males with increasing temperature during development. The bars show the proportion of phenotypic males that are either genotypic XX or XY. The box above each bar contains number and the percentage of XX males. The box within each bar lists the number of the XY males.

