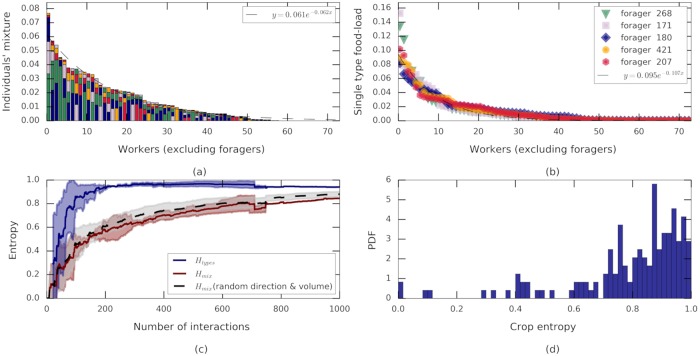
Fig 2. Food spread and source blending across the colony.
(a) The amount of food held by each non-forager ant a at the end of the experiment, P(a), partitioned into conditional probabilities P(f|A = a) by forager origin (f = 268, green, f = 171 purple, f = 180 blue, f = 421 orange, f = 207 pink; vertically ordered by amounts received). Ants are ordered by the amount of food in their crop, and the dashed line is an exponential fit y = ae−bx,a = 0.061 ± 0.002, b = 0.062 ± 0.003, R2 = 0.96. For colonies B and C see S2 Fig. (b) The extent to which food from each forager f (color code as in panel a) was distributed among non-forager ants a: P(a|F = f). Recipient ants are ordered (per forager f) by amount received. Dashed curve is an exponential fit y = ae−bx, a = 0.095 ± 0.0013, b = 0.1 ± 0.002, R2 = 0.97. For colonies B and C see S2 Fig. (c) Mixing entropies as a function of the number of trophallactic interactions starting from the first return of a loaded forager. Entropies are normalized by to allow for data averaging over the three experiments. Lines are the mean over three experiments while shaded areas designate standard deviations. Depicted are the empirical entropy associated with the different proportions of food as brought in by each forager Htypes (blue), the empirical mixing entropy over all non-forager ants Hmix, (red) and the mixing entropy for hybrid simulations where randomized interaction volumes and transfer directions were simulated over the empirical interaction schedule (N = 30, shaded area depicts standard deviation of the outcomes). Discontinuities are a consequence of the variable number of interactions among the three experiments. (d) A histogram of normalized individual mixing entropies of all non-forager ants, , at the end of the experiments (all three experiments, N = 203 ants).

