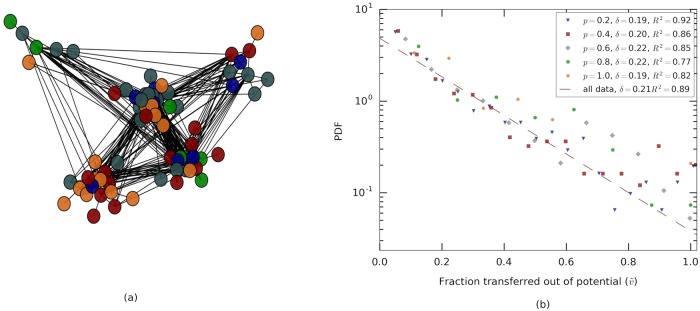
Fig 3. The network of pairwise interactions and the flow of food over interactions.
(a) Visualization of the undirected trophallactic network (Colony A). Ants are represented by vertices and interactions are edges using the spring embedded layout from Networkx [37]. Nodes are colored according to maximally modular communities which, nevertheless, display low modularity with 191 intra-community and 223 inter-community links (Details: Number of communities = 5, transitivity = 0.38, modularity = 0.185, quality performance = 0.76). For colonies B and C, see S3 Fig. (b) Probability density as a function of the transfer ratio. Different colors relate to the maximal potential interaction p = d(1 − r) where p ∈ [0, 1] is the volume potential as determined by d, r ∈ [0, 1] donor’s and recipient’s crop load expressed as a fraction of the capacity of each ant. The distribution of interaction volumes per each transfer potential, p, were estimated by exponential functions in which the values of the parameter δ were determined using maximal likelihood. These values of δ all produce decent fits (R2 values are indicated in figure legend) and are, largely, independent of the maximal transfer potential. This implies that the ants control the fraction of volume transferred (out of the maximal possible interaction volume) rather than absolute amounts. Data depict interactions from all three experiments (N = 2141 interactions).

