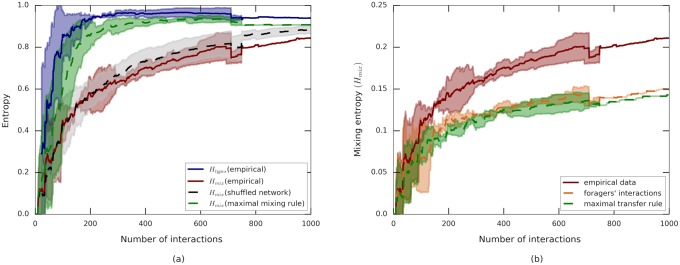
Fig 4. Mixing as a function of the number of interactions.
Plots compare empirical data and hybrid simulations. Entropies are normalized by , solid lines show the empirical mean over the three experiments, dashed lines represent means over hybrid simulations. Shaded areas depict standard deviations. (a) The mixing entropy, Hmix, in simulations with maximally mixing interactions applied over the empirically measured network (green curve) nearly saturates the empirically assessed upper bound Htypes (blue curve). Mixing entropy, Hmix, in simulations where the empirically derived interaction rule is applied over maximally mixing interaction networks shows a limited rise which compares with empirical mixing rates (red curve). (b) Hybrid simulations of two extreme interaction rules preserving the empirically measured interaction schedule. The orange curve shows Hmix using only the transfers between foragers and non-foragers (i.e., all non-forager to non-forager interactions were set to zero). The green curve depicts Hmix where every transfer is assumed to be at its maximal possible volume. These rules lead to mixing levels that are lower than those measured experimentally (red curve). Discontinuities in the plots are a consequence of the variable number of interactions among the three experiments.

