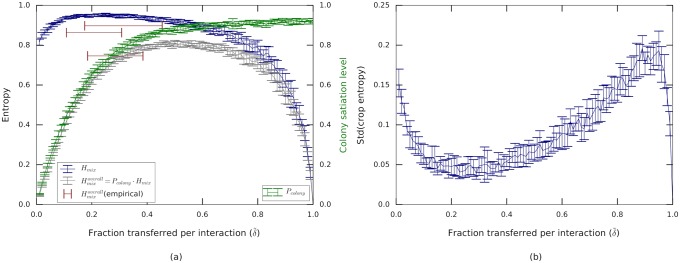
Fig 5. Trade-off between fast dissemination and efficient mixing described by the model.
(a) While the colony state (Pcolony, green) rises with the fraction of transferred volume, mixing levels among non-foragers (which we call Hmix) decrease. The mixing levels over all ants in the colony (including the foragers) is the product of these two functions, and displays a broad maximum which spans all non-extreme values of . Curves can be compared to the empirically measured values (red bars) of the three experiments. (b) Standard deviation of individual mixing entropies across all ants. Standard deviations were calculated for 30 model runs. The plot depicts the mean and standard deviation of this value.

