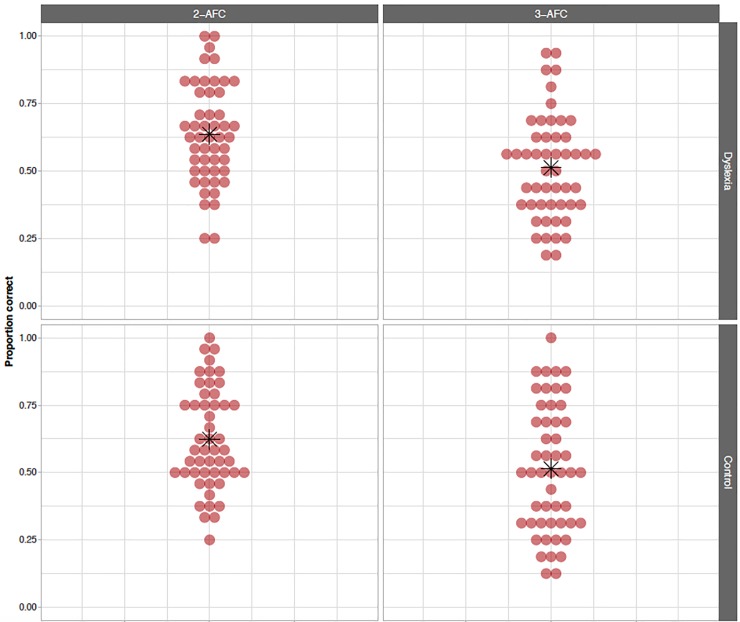
Fig 3. VSL offline 3-AFC and 2-AFC measures.
Proportion of correct responses on 2-AFC (left, chance level = .500) and 3-AFC questions (right, chance level = .333) for participants with dyslexia (top) and control participants (bottom). Red dots indicate individual scores, while the group mean is indicated using a black asterisk.

