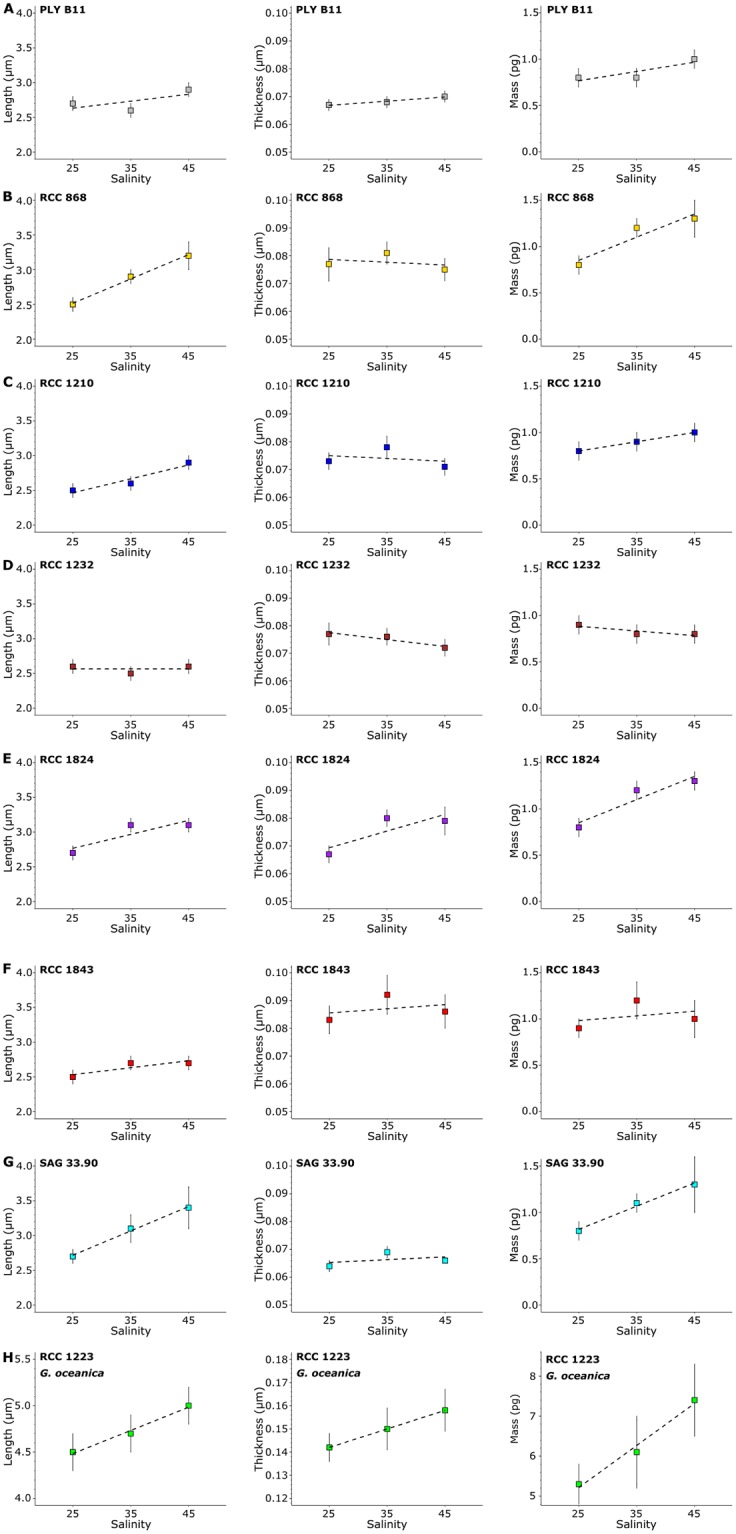
Fig 3. Mean values of measured coccolith length, mean thickness, and mass versus salinity.

Each plot represents one strain: A: PLY B11 (E. huxleyi). B: RCC 868 (E. huxleyi). C: RCC 1210 (E. huxleyi). D: RCC 1232 (E. huxleyi). E: RCC 1824 (E. huxleyi). F: RCC 1843 (E. huxleyi). G: SAG 33.90 (E. huxleyi). H: RCC 1223 (G. oceanica). Vertical bars: 95% confidence interval of the mean value. Dashed line: Trend line of parameter with increasing salinity.
