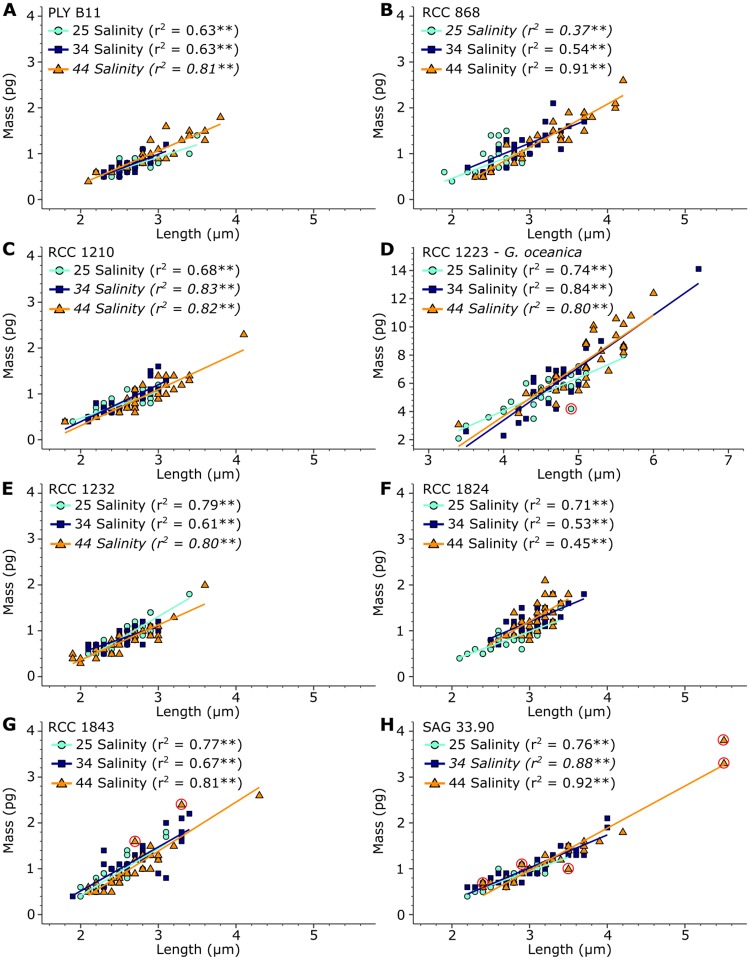
Fig 4. Scatter plots of coccolith length versus coccolith mass for all strains and salinities analysed.
Cyan dots: coccoliths cultured under 25 salinity conditions. Blue squares: coccoliths cultured under 34 salinity conditions. Orange triangles: coccoliths cultured under 44 salinity conditions. Colored lines: linear regression lines for each sample. “*” indicates a significant relationship with p<0.05, while “**” indicates a significant relationship with p<0.01. r2 values in italics were obtained after log-transformation. Red circles show data points that were found to be influential according to the R functions gvlma and qqPlot.

