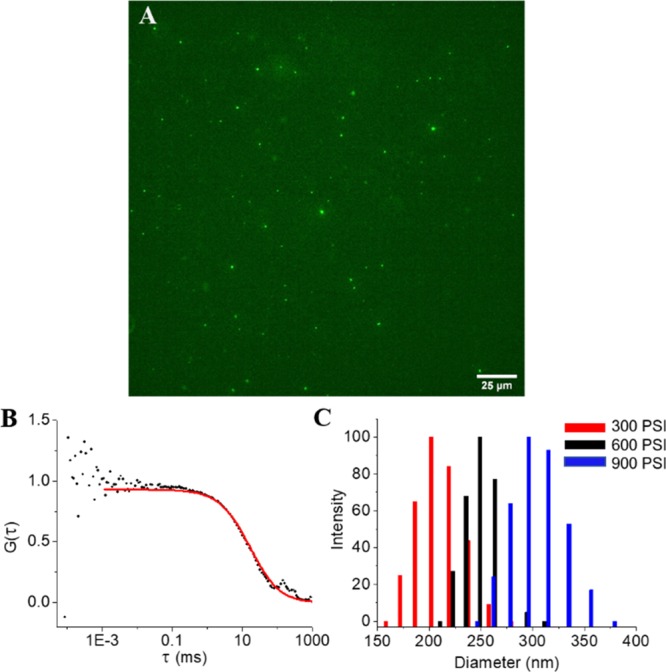
Figure 1.

Cell-derived vesicle characterization. (A) Wide-field fluorescence image of vesicles loaded with the fluorescent dye fluorescein. (B) Fluorescence correlation spectroscopy correlogram of vesicles used to determine vesicle concentration and relative yield. (C) Plot of vesicle size distribution at different cavitation pressures as determined by dynamic light scattering.
