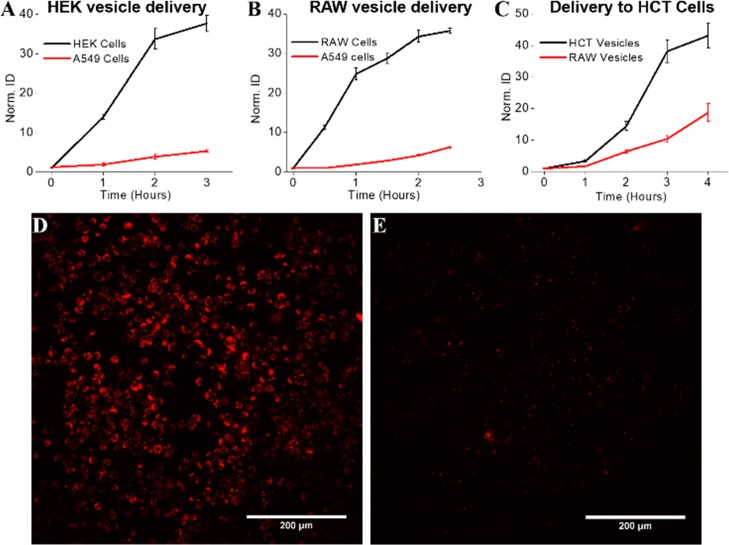
Figure 2.
Cell-targeting specificity. (A) Comparison of HEK vesicles delivered to HEK cells (black) versus HEK vesicles delivered to A549 cells (red). (B) Comparison of RAW vesicles delivered to RAW cells (black) versus RAW vesicles delivered to A549 cells (red). (C) Comparison of HCT vesicles delivered to HCT cells (black) versus RAW vesicles delivered to HCT cells (red). (D) Wide-field fluorescence image of DiI-labeled RAW vesicles delivered to RAW cells after 2.5 h showing clear loading. (E) Wide-field fluorescence image of DiI-labeled RAW vesicles delivered to A549 cells after 2.5 h showing limited cellular uptake. Norm ID is the integrated density of the image normalized to the time 0 value. Each data point is the average of five experiments. A Student’s t-test was used to determine significance between end points. Each end point was significant with a p value of <.001.

