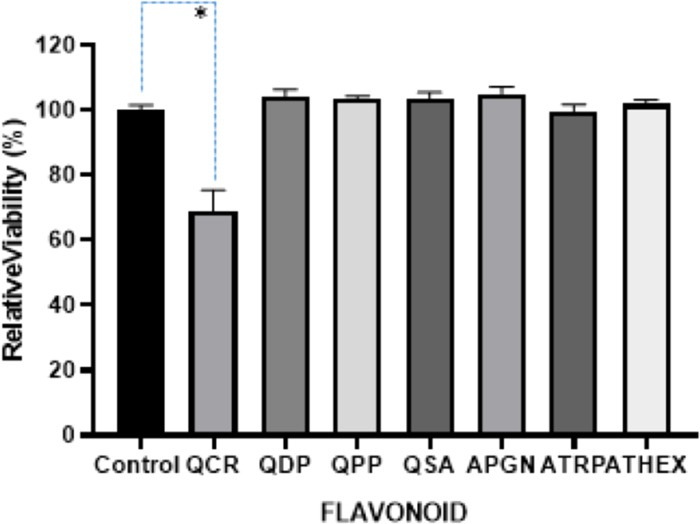
Figure 4.

Relative viability of P. aeruginosa after 16 h growth with test compounds. The error bars showed +1 standard deviation for each measurement with three replicates. *p < 0.0001. One-way ANOVA followed by Dunnett’s multiple comparisons test was performed using the GraphPad Prism, 8.0 GraphPad Software.
