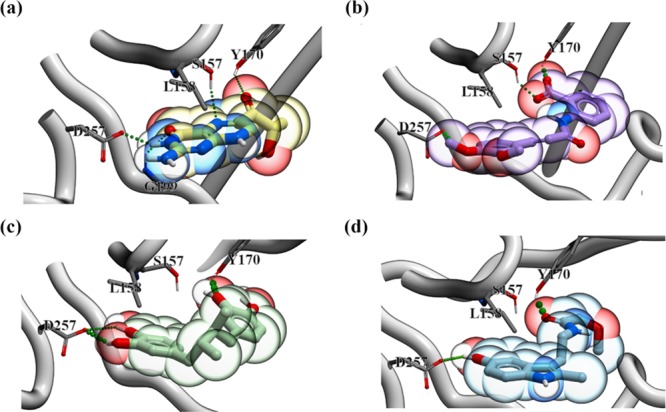
Figure 3.

SPR–drug complexes obtained by docking. (a) hSPR–sepiapterin, (b) hSPR–tranilast, (c) hSPR–NDGA, and (d) hSPR–SPRi3 complexes are shown in the figure. The hydrogen bonds between hSPR and drugs are shown in green. The drugs are shown in the colored bubble (sepiapterin in yellow, tranilast in purple, NDGA in green, and SPRi3 in blue) with polar groups within the drug structure indicated (red = negative and blue = positive). hSPR is shown in cartoon. The residues of hSPR interacting with the drugs in Molsoft ICM visualization are labeled and shown in sticks.
