
Figure 4.
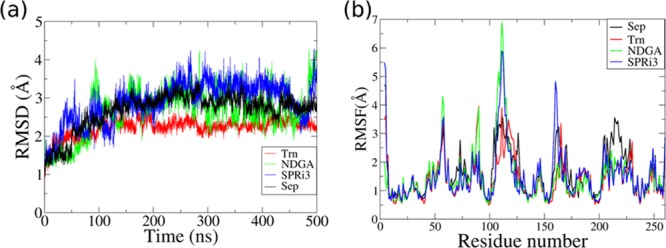
Comparison of hSPR behavior in simulations of hSPR–drug complexes. (a) RMSD and (b) RMSF plots were used to compare the deviations and fluctuations in the hSPR structure in the simulations of hSPR–sepiapterin (Sep), hSPR–tranilast (Trn), hSPR–NDGA, and hSPR–SPRi3 complexes. The hSPR–tranilast complex showed the lowest RMSD and least fluctuations in the 500 ns long MD simulation.